News from Russia and CIS countries
Foreign trade of the Russian Federation. Data from the Federal Customs Service of Russia 2021 In 2021, Russia exported 2.3 million tons of cellulose and 1.1 million tons of newsprint. In December, 57.6 thousand tons of coated papers and cardboards, as well as finished printed products worth $28 million were imported into the country
According to customs statistics, in January-December 2021, Russia's foreign trade turnover amounted to 571.9 billion US dollars and decreased by 15.2% compared to January-December 2021.
The trade balance was positive in the amount of 104.5 billion US dollars, which is 73.9 billion US dollars less than in January-December 2021 (-41.4%).
EXPORT
Russia's exports in January-December 2021 amounted to 338.2 billion US dollars and decreased by 20.7% compared to January-December 2021. The share of non-CIS countries accounted for 85.6%, and the CIS countries – 14.4%.
The basis of Russian exports in January-December 2021 was traditionally fuel and energy goods, the share of which in the commodity structure of exports amounted to 49.6% (in January-December 2021 - 62.1%).
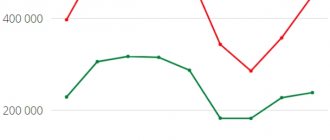
Share of exports of timber and pulp and paper products
in January-December 2021 amounted to 3.7% (in January-December 2019 – 3.0%).
In the commodity structure of exports to non-CIS countries, the share of these goods was 3.5% (in January-December 2021 - 2.8%), to the CIS countries - 4.7% (4.5%).
The value volume of exports of this product group decreased by 3.3%, and the physical volume increased by 1.6%.
newsprint exports decreased
, lumber - by 6.6%, unprocessed timber - by 2.0%, while the supply volumes
of cellulose
by 12.9%, plywood - by 5.8%.
Commentary from SBO-PAPER.RU on pulp prices
In December, 71.7% of all exported pulp (164.4 thousand tons) was sent to China.
As for newsprint, in the last month of the past year, 42.0% of the export volume (29.1 thousand tons) was shipped to China, 13.9% went to India (9.7 thousand tons), and 4.1 % - to Germany (2.8 thousand tons).
IMPORT
Russia's imports in January-December 2021 amounted to 233.7 billion US dollars and decreased by 5.7% compared to January-December 2021. The share of non-CIS countries accounted for 89.3%, and the CIS countries – 10.7%.
In the commodity structure of imports, the largest share fell on machinery and equipment - 47.6% (in January-December 2021 - 46.1%).
Pulp and paper products and finished printed products
In December 2021, 18.9 thousand tons of cellulose were imported under codes 4702-4704 (from the USA, Finland, Sweden and Belarus), as well as 1.2 thousand tons of Belarusian newsprint.
In December 2021, 57.6 thousand tons of coated paper and cardboard (code 4810) were imported, of which 25.5 thousand tons (44.2%) were from Finland.
Import code 4810 (December 2021)
GROUP 49. Printed books, newspapers, reproductions and other products of the printing industry; manuscripts, typescripts and plans
In group 49, in December 2021, products were imported for a total amount of $28 million
FOR REFERENCE: Import volumes according to some HS codes of group 49, 4th quarter of 2021, million US dollars
| HS Code | Name | Statistical cost, million dollars. USA | ||
| December 2020 | November 2020 | October 2020 | ||
| 4901 | Printed books, brochures, leaflets and similar printed matter, bound or in loose sheets | 10,7 | 11,2 | 9,2 |
| 4902 | Newspapers, magazines and other periodicals, whether or not illustrated and whether or not containing advertising material | 2,4 | 1,8 | 1,3 |
| 4903 | Picture books, drawing or coloring books, children's books | 0,5 | 0,7 | 1,1 |
| 4909 | Postcards, printed or illustrated; cards with printed greetings, messages or messages, whether illustrated or not, with envelopes | 0,1 | 0,2 | 0,1 |
| 4910 | Printed calendars of all types, including tear-off calendars | 0,4 | 0,5 | 0,3 |
THE LARGEST TRADING PARTNERS OF THE RF IN 2021
In the country structure of Russia's foreign trade, the leading place is occupied by the European Union, as the country's largest economic partner. The share of the European Union in January-December 2021 accounted for 38.5% of Russian trade turnover (in January-December 2019 - 41.6%), the CIS countries - 12.9% (12.2%), the EAEU countries - 9.1% (8.7%), for APEC countries - 33.8% (31.8%).
The main trading partners of Russia in January-December 2021 among non-CIS countries were:
- China, trade turnover with which amounted to 103.9 billion US dollars (93.3% by January-December 2021),
- Germany – $41.9 billion (78.9%),
- Netherlands – USD 28.6 billion (58.6%),
- United Kingdom – $26.6 billion (⬈ 153.6%),
- USA – USD 23.9 billion (91.1%),
- Türkiye – USD 20.8 billion (79.8%),
- Italy – USD 20.2 billion (80.1%),
- Republic of Korea – USD 19.6 billion (80.5%),
- Japan – $16.2 billion (79.6%),
- Poland – USD 14.3 billion (80.3%).
CIS and EAEU COUNTRIES
Belarus remains Russia’s largest partner, trade turnover with which amounted to $30.2 billion (-14.75% compared to 2019).
This is followed by Kazakhstan ($19.1 billion, -4.9%) and Ukraine ($9.9 billion, -13.5%).
The fourth place is occupied by Uzbekistan, trade turnover with which increased by 15.6% and amounted to $5.9 billion.
Commentary from SBO-PAPER.RU on pulp prices:
In January 2021, pulp prices increased sharply (across all regions: Europe, North America, China)
For example, in China, prices for softwood pulp increased in 2 months. (from the beginning of December to the end of January) amounted to 150 US dollars per ton (+24.4%). To be fair, it should be noted that in the summer, prices in China for both softwood and hardwood pulp were minimal, so for now we are only talking about their recovery...
SBO-PAPER.RU regularly monitors the prices of pulp and paper for writing and printing. We prepare analytical reports upon request
CLOSEd 2021. Analytics SBO-PAPER.RU LATEST PUBLICATIONS
Source: SBO-PAPER.RU / Ekaterina Kirichenko
15.02.2021
Insidious statistics: where do discrepancies in foreign trade data come from?
2. Different approaches to the classification of goods moved within the framework of mutual trade. In different countries, the same product can be classified by different HS codes (commodity nomenclature for foreign economic activity). For example, Korean car kits supplied for assembly to factories in Russia are classified by the Koreans as finished cars, and in Russia - as a set of components (engines, bodies, chassis), each of which has its own code. In the first half of 2021, imports of Korean passenger cars to Russia (code 8703) were lower than Korean exports to Russia, and for spare parts for automobiles, Russian imports exceeded Korean exports.
3. Inclusion of data relating to the same transaction in different periods (so-called carryover deliveries). This is especially true for trade between countries that are distant from each other. Delivery time in this case can vary greatly depending on the transport used or the characteristics of the goods being transported. Goods cleared for export at the end of 2021, taking into account transportation time, will be taken into account in the import of the partner country at the beginning of 2021.
Read on RBC Pro
Storm on the labor market: why Russian companies refuse applicants
“Gifts” from the Federal Tax Service: how taxes will change on January 1, 2022
There is a new boom in the US real estate market. How can an investor make money from this?
How to play on the stock exchange in 2022. Sber analysts' forecasts
4. Re-export of goods produced in third countries. Almost all countries include goods of non-own origin in their exports. In imports of the receiving country (in accordance with the international methodology for accounting for goods recommended by the UN), these goods are recorded by country of origin. This factor greatly influences the discrepancies in customs statistics between Russia and EU countries.
In particular, in 2021, Russia's imports from Finland were lower than Finland's exports to Russia. This is due to the fact that about 61% of goods imported from Finland to Russia were produced in other EU countries, China, the USA or Japan. They were partly included in Finland's exports to Russia, and in Russian imports they were taken into account by country of origin.
5. Deliveries of Russian goods and goods produced by a trading partner country from the territories of third countries. This is especially typical for the supply of goods of Chinese origin to Russia from other territories (EU, Hong Kong, Republic of Korea). In Russian imports they are taken into account by country of origin (China), but are not reflected in Chinese data on exports to Russia. This is due to the excess of Russian data, in particular, for goods of the 84th group of the commodity nomenclature (nuclear reactors, boilers, equipment and mechanical devices) and the 85th group (electrical machines and equipment, their parts).
6. Carrying out expert additional calculations (typical for EAEU member states). Russia's imports from Kyrgyzstan in 2018 were $65.8 million lower than Kyrgyzstan's exports to Russia. The discrepancies are caused by the Kyrgyz side carrying out additional calculations for the import and export of goods by individuals based on a sample survey of border checkpoints. The results of the additional calculations are added to the volume of exports and imports of Kyrgyzstan with the member states of the EAEU.
In the Republic of Belarus, additional calculations are also carried out, in particular for vegetables, and in Armenia, to generate mutual trade data, an additional source of information is used - transit declarations on the movement of goods between Russia and Armenia through the territory of Georgia.
7. Classification of information about certain product items as confidential information. In Russia, data on such goods is included in the overall trade results, and a number of countries, for example Finland, close information on some goods at the request of foreign trade participants, which affects discrepancies in the data.
As we see, in all these cases we are not talking about violations of laws, but about objective differences in the structure of customs statistics in different countries.
News from Russia and CIS countries
11/27/2021 Change of management at Mozhaisk Printing Plant JSC Who joined the new Board of Directors?
11.23.2021 The regional stage of WorldSkills Russia in the “Printing Technologies” competency was held in Tatarstan. The names of the winners will be known in early December, the champions will be part of the Tatarstan national team
05.11.2021 PAP-FOR. Exhibition of the pulp and paper industry November 09–12, 2021. St. Petersburg, ExpoForum Convention and Exhibition Center, Pavilion F
03.11.2021 Solikamskbumprom continues to develop the line of packaging papers. A new production line is being installed at the enterprise
01.11.2021 Kama Cardboard products have received ISEGA certificates CONFIRMED: cardboards comply with European food industry standards
Archive
Customs statistics. Statistical form for recording the movement of goods within the Customs Union
Customs statistics – collection, processing and submission in a certain form of data on the movement of goods across the customs border in order to analyze the state and dynamics of the further development of foreign trade and the economy as a whole.
The basic principles of maintaining customs statistics are regulated by the Customs Code of the Customs Union and the Federal Law “On Customs Regulation in the Russian Federation”. Additionally, this area of customs relations is regulated by:
— Agreement dated January 25, 2008 “On maintaining customs statistics of foreign and mutual trade in goods of the Customs Union” concluded between the Governments of the Republic of Belarus, the Republic of Kazakhstan and the Russian Federation; — Decision of the Customs Union Commission dated January 28, 2011 No. 525 “On the Unified Methodology for Maintaining Customs Statistics of Foreign Trade and Statistics of Mutual Trade of the Member States of the Customs Union”; — Decree of the Government of the Russian Federation dated January 29, 2011 No. 40 “On the organization of maintaining statistics of mutual trade of the Russian Federation with member states of the Customs Union within the framework of the EurAsEC”
Customs statistical data is submitted to the Customs Union at two levels:
— national statistics; - All-Union statistics.
To maintain all-Union customs statistics, the Customs Union Commission uses the Center for Customs Statistics, which performs the following functions:
— receives statistical data from authorized national bodies of the CU member countries; — based on the information received, generates general statistical data; — publishes the received data within the time limits and in the form established by the legislation of the Customs Union; — provides general data to the authorized bodies of the CU member countries.
In the CU member countries, the systems for collecting and processing customs statistical data have their own distinctive features. To bring customs statistical data collection systems to a single standard and simplify data processing by the Center for Customs Statistics within the customs union, the following are in effect:
— Unified methodology of customs statistics; — Unified Commodity Nomenclature for Foreign Economic Activity of the Customs Union (TN FEACN of the Customs Union).
The Commodity Nomenclature of Foreign Economic Activity of the Customs Union is based and developed on the basis of the Harmonized System for Description and Coding of Goods of the WTO and the Commodity Nomenclature of Foreign Economic Activity of the CIS.
Due to insufficient unification of national systems for maintaining customs statistics, discrepancies are possible in statistical data on trade of the CU member countries with other countries. To eliminate these discrepancies and ensure the reliability of the data, the authorized bodies of the participating countries conduct a comparative analysis of the results of trading activities to identify and eliminate the causes of possible discrepancies.
At the national level, customs statistics are maintained by authorized bodies. In the Russian Federation, the authorized body is the Federal Customs Service.
The main source of information for maintaining customs at the national level is the data specified in customs declarations, statistical forms for recording the movement of goods within the Customs Union and other documents provided to the customs authorities.
Statistical form for recording the movement of goods within the Customs Union
It is worth mentioning separately the statistical form for recording the movement of goods within the Customs Union, which is filled out by the applicant. The applicant may be a person:
- concluded a deal; - on whose behalf or on behalf of whom the transaction was concluded; - having the right to own, dispose or use the goods.
The obligation to fill out the Statistical Form arises in relation to goods imported into the territory of the Russian Federation from the territory of the member states of the Customs Union or exported from the territory of the Russian Federation to the territory of the member states of the Customs Union.
Cases when the Statistical Form is not filled out:
— movement of goods by individuals for personal use; - movement of goods by certain categories of persons enjoying advantages and privileges, diplomatic missions, consular offices for personal use; — movement of transit goods; — movement of goods by rail.
When moving goods by rail, statistical information is taken from transportation documents and provided independently by the carrier.
The statistical form is filled out electronically before the start of transportation of goods, but not earlier than 15 days. The software used to fill out statistical data is posted on the official website of the Federal Customs Service of the Russian Federation. The statistical form is filled out in Russian and has a legally prescribed form and rules for filling it out. When you fill out the form, a registration number is automatically assigned. From June 1, 2011, the statistical form, printed on paper with an assigned number, is a mandatory accompanying document for the goods during their transportation.
(doc)
Errors made when filling out the statistical form must be corrected electronically within 10 days from the moment they were identified. In this case, an updated form is filled out, which indicates the registration number of the statistical form to which changes are made. The applicant is responsible for ensuring that the form is completed correctly. It is worth noting that the carrier is subject to administrative liability for the absence of a form.
Customs statistics take into account all imported or exported goods. But there are a number of goods that are not taken into account in customs statistics. These are the products:
- temporarily imported or temporarily exported for a period of no more than 1 year; — transit; - intended for export outside the Russian Federation, placed in a free warehouse, customs warehouse, customs zone; — foreign goods destroyed on the territory of the Russian Federation.
There are also three categories of goods that are not subject to customs registration:
— goods whose value does not exceed the statistical threshold; — securities in circulation, monetary gold, foreign and national currency that has no numismatic value; - goods that are not the subject of commercial transactions.
Statistical threshold - the quantity of a product, expressed in its statistical value or units of quantitative accounting, established by law, below which the product is not taken into account in customs statistics.
Goods are recorded in customs statistics based on their statistical value or units of quantitative accounting.
Statistical value is the cost of a product expressed in US dollars. On the territory of the Russian Federation, the cost is converted into rubles at the official rate established by the Central Bank of the Russian Federation. Quantitative accounting units mean: net weight in kg, total weight in kg, pieces, liters, m3, and other units of measurement of the quantity of goods provided for by the CU FEACN.
The FCS publishes the obtained statistical data within the time limits and in the forms established by the legislation of the Russian Federation. The provision of unpublished data that does not contain state or other secrets protected by law, or other information with limited access, is carried out in the manner and for a fee established by law.
You can get acquainted with the available statistical data by following the following links: Foreign trade statistics, Mutual trade statistics, Foreign trade of the Russian Federation by goods.
When using publication materials, an active hyperlink to https://customsexpert.ru is required.
| May 19, 2011 / | Customs |
| Author / | Portal Administration | |||||
| print version |
| Tweet |
Federal Customs Service of Russia: data on exports and imports of the Russian Federation for 2021
According to customs statistics, in January-December 2021, Russia's foreign trade turnover[1] amounted to $692.6 billion and increased by 17.6% compared to January-December 2021.
The trade balance was positive in the amount of $211.6 billion, which is $80.6 billion more than in January-December 2021.
Russia's exports[2] in January-December 2021 amounted to 452.1 billion US dollars and increased by 25.6% compared to January-December 2021. Non-CIS countries accounted for 87.9% of total exports, and CIS countries – 12.1%.
The basis of Russian exports has traditionally been fuel and energy goods, the share of which in the commodity structure of exports amounted to 63.7% (in January-December 2021 - 59.3%). In the commodity structure of exports to non-CIS countries, the share of these goods was 67.6% (in January-December 2021 - 63.4%), to the CIS countries - 35.9% (32.9%).
Compared to January-December 2021, the value volume of fuel and energy goods increased by 35.2%, and the physical volume by 6.4%. Among the goods of the fuel and energy complex, the physical volumes of exports of kerosene increased by 17.5%, coal - by 10.0%, natural gas - by 3.7%. At the same time, the physical volumes of exports of hard coke decreased by 6.2% and liquid fuels by 6.0%.
In the total value of exports, the share of metals and products made from them in January-December 2021 amounted to 9.9% (in January-December 2017 - 10.4%). In the commodity structure of exports to non-CIS countries, the share of these goods was 9.5% (in January-December 2017 - 10.1%), to the CIS countries - 12.8% (12.3%).
The value volume of exports of these goods increased by 19.9% compared to January-December 2021, and the physical volume - by 8.5%. The physical volumes of export supplies of cast iron increased by 19.7%, semi-finished products from iron and unalloyed steel - by 11.2%, copper and copper alloys - by 10.5%. At the same time, the physical volumes of exports of flat rolled iron and non-alloy steel decreased by 3.3%, aluminum - by 1.3%.
The share of exports of chemical industry products in January-December 2021 amounted to 6.1% (in January-December 2021 - 6.7%). In the commodity structure of exports to non-CIS countries, the share of these goods was 5.2% (in January-December 2021 - 5.4%), to the CIS countries - 12.7% (14.9%).
Compared to January-December last year, the value of exports of these products increased by 14.2%, and the physical volume - by 3.5%. The physical volumes of exports of inorganic chemical products increased by 19.6%, plastics and products made from them - by 5.4%, pharmaceutical products - by 2.4%, soap and detergents - by 1.5%. At the same time, the physical volumes of mineral and potash fertilizers decreased by 19.9%, perfumes and cosmetics - by 14.9%.
The share of exports of machinery and equipment in the commodity structure of exports in January-December 2021 amounted to 6.5% (in January-December 2017 - 7.9%). In the commodity structure of exports to non-CIS countries, the share of these goods was 4.9% (in January-December 2017 - 6.4%), to the CIS countries - 17.8% (17.5%).
The value of exports of this product group increased by 2.7%, including an increase in supplies of electrical equipment by 13.0%, and mechanical equipment by 6.6%. At the same time, supplies of optical instruments and apparatus decreased by 7.5%. The physical volumes of supplies of passenger cars increased by 10.1%, and trucks – by 3.0%.
The share of exports of food products and raw materials for their production in the commodity structure of exports in January-December 2018 amounted to 5.5% (in January-December 2021 - 5.8%). In the commodity structure of exports to non-CIS countries, the share of these goods was 5.0% (in January-December 2021 - 5.1%), to the CIS countries - 9.2% (10.1%).
Compared to January-December 2021, the value and physical volumes of supplies of these goods increased by 20.2% and 19.2%, respectively. The physical volumes of exports of fresh and frozen meat increased by 65.6%, wheat – by 33.0%.
The share of exports of timber and pulp and paper products in January-December 2021 amounted to 3.1% (in January-December 2021 - 3.3%). In the commodity structure of exports to non-CIS countries, the share of these goods was 2.9% (in January-December 2021 - 3.1%), to the CIS countries - 4.4% (4.3%).
The value volume of exports of this product group increased by 18.4%, and the physical volume - by 4.2%. The physical volumes of supplies of plywood increased by 8.7%, lumber – by 6.7%, cellulose – by 0.8%, while the volumes of supplies of unprocessed timber decreased by 2.1%.
Russia's imports[3] in January-December 2021 amounted to $240.5 billion and increased by 5.1% compared to January-December 2021. Non-CIS countries accounted for 89.0% of total imports, CIS countries – 11.0%.
In the commodity structure of imports, the largest share was accounted for by machinery and equipment, which amounted to 47.3% in January-December 2021 (48.6% in January-December 2021). In the commodity structure of imports from non-CIS countries, the share of these goods was 50.6% (in January-December 2021 - 51.8%), from the CIS countries - 20.5% (22.0%).
The value of imports of these products increased by 2.0% compared to January-December 2021, including electrical equipment - by 11.8%, instruments and optical devices - by 8.9%. The physical volume of imports of passenger cars increased by 9.5%, and imports of trucks decreased by 17.9%.
The share of chemical industry products in the commodity structure of imports in January-December 2021 amounted to 18.3% (in January-December 2021 - 17.7%). In the commodity structure of imports from non-CIS countries, the share of these goods was 18.7% (in January-December 2021 - 18.2%), from the CIS countries - 14.8% (13.4%).
The value volume of imports of chemical industry products increased by 8.1% compared to January-December 2021, and the physical volume - by 1.2%. The physical volumes of supplies of soap and detergents increased by 7.3%, rubber and products made from them - by 6.9%, plastics and products made from them - by 3.4%, organic chemical products - by 1.4%.
The share of imports of food products and raw materials for their production in January-December 2021 amounted to 12.4% (in January-December 2021 - 12.7%). In the commodity structure of imports from non-CIS countries, the share of these goods was 11.2% (in January-December 2021 - 11.5%), from the CIS countries - 22.3% (22.5%).
The value and physical volumes of imports increased by 2.4% and 1.6%, respectively. The supply of wheat increased by 27.0%, palm oil - by 18.9%, cheeses and cottage cheese - by 17.9%, citrus fruits - by 7.4%. At the same time, the physical volumes of supplies of fresh and frozen meat decreased by 36.7%, milk and cream - by 21.1%, butter - by 10.5%.
The share of metals and products made from them in the commodity structure of imports in January-December 2021 amounted to 7.2% (in January-December 2017 – 6.9%). In the commodity structure of imports from non-CIS countries, the share of these goods was 5.9% (in January-December 2017 - 5.7%), from the CIS countries - 17.3% (16.9%).
The value volume of this product group increased by 8.5% compared to January-December 2021, and the physical volume by 1.6%. The physical volumes of imports of ferrous metals and products made from them increased by 1.9%, while the supply of pipes decreased by 22.1%, rolled flat iron and non-alloy steel - by 4.2%.
The share of imports of textiles and footwear in January-December 2021 amounted to 6.2% (in January-December 2021 – 6.0%). In the commodity structure of imports from non-CIS countries, the share of these goods was 6.1% (in January-December 2021 - 5.8%), from the CIS countries - 7.4% (7.1%).
The value and physical volumes of imports of these goods increased compared to the same period last year by 9.2% and 2.5%, respectively.
The share of imports of fuel and energy goods in January-December 2018 was 1.0% (in January-December 2021 – 0.9%). In the commodity structure of imports from non-CIS countries, the share of these goods was 0.6% (in January-December 2021 - 0.5%), from the CIS countries - 4.2% (4.6%).
The value volume of this product group increased by 8.2% compared to January-December 2021, while the physical volume decreased by 2.0%.
In the country structure of Russia's foreign trade, the leading place is occupied by the European Union, as the country's largest economic partner. The share of the European Union in January-December 2021 accounted for 42.7% of Russian trade turnover (in January-December 2017 - 42.1%), the CIS countries - 11.7% (12.5%), the EAEU countries - 8.1% (8.8%), for APEC countries – 31.0% (30.4%).
Russia's main trading partners in January-December 2021 among non-CIS countries were: China, trade turnover with which amounted to $108.3 billion (124.5% compared to January-December 2021), Germany – $59.6 billion. USA (119.3%), Netherlands - $47.2 billion (119.4%), Italy - $27.0 billion (112.7%), Turkey - $25.6 billion ( 115.7%), United States - $25.0 billion (107.9%), Republic of Korea - $24.8 billion (129.1%), Poland - $21.7 billion ( 131.0%), Japan - 21.3 billion US dollars (117.0%), France - 17.2 billion US dollars (111.2%).
Trade volumes with CIS countries in January-December 2017-2018 are given below:
million US dollars
| EXPORT | IMPORT | |||
| January-December 2021 | January-December 2021 | January-December 2021 | January-December 2021 | |
| AZERBAIJAN | 1 934,8 | 1 713,5 | 692,5 | 773,3 |
| ARMENIA | 1 247,0 | 1 341,4 | 528,8 | 627,0 |
| BELARUS* | 19 573,8 | 22 779,8 | 12 643,4 | 12 906,4 |
| KAZAKHSTAN | 12 465,4 | 12 923,3 | 5 016,4 | 5 295,9 |
| KYRGYZSTAN | 1 399,4 | 1 635,4 | 212,1 | 248,3 |
| MOLDOVA | 864,5 | 1 204,6 | 352,8 | 355,5 |
| TAJIKISTAN | 692,3 | 849,6 | 25,2 | 44,3 |
| TURKMENIA | 343,8 | 288,8 | 84,5 | 155,2 |
| UZBEKISTAN | 2 625,1 | 3 320,8 | 1 026,6 | 1 063,0 |
| UKRAINE | 7 943,1 | 9 522,7 | 4 912,1 | 5 461,2 |
* Includes additional calculations for unaccounted volumes of mutual trade between the Russian Federation and the Republic of Belarus.
- Russia's imports of the most important goods for January - December 2018
- Russia's exports of the most important goods for January - December 2018
[1] The foreign trade turnover of Russia includes fish and seafood of the Russian Federation that are not subject to delivery for customs clearance on the territory of the Russian Federation; bunker fuel, fuel, food and materials purchased outside the territory of the Russian Federation; goods and vehicles imported/exported by individuals; additional calculations for unaccounted volumes of mutual trade with the EAEU countries.
[2] Russian exports include fish and seafood of the Russian Federation that are not subject to delivery for customs clearance on the territory of the Russian Federation; vehicles, additional calculations for unaccounted volumes of mutual trade with the EAEU countries.
[3] Russian imports include bunker fuel, fuel, food and materials purchased outside the territory of the Russian Federation; goods and vehicles imported by individuals; additional calculations for unaccounted volumes of mutual trade with the EAEU countries.
Our principles of working with customers
The right question is half the answer
If you suddenly don’t know the HS code of the product you are interested in, or find it difficult to formalize the task, no problem. We will help you choose the right code or filter the necessary information from foreign trade data using a set of keywords.
Let yourself be tested, then they will believe you!
When you contact us, along with a commercial offer, you receive a demo sample with customs statistics specifically for your HS code (or other parameter). Before purchasing information from the customs database, you will already have an idea of the composition of the information received, which will allow you to avoid unpleasant surprises.
Submission of a statistical report to the Federal Customs Service in electronic form
STATFORM for customs when exporting to the EAEU, how to fill out in 1C?
When exporting from the EAEU, the Organization is obliged to submit to the Federal Customs Service (Federal Customs Service) a Statistical form for recording the movement of goods (approved by Decree of the Government of the Russian Federation of June 19, 2020 N 891).
The statistical form in the Federal Customs Service is drawn up in the Reports section - Regulated reports - Create button - All tab - folder By recipients - FCS folder - Statistical form for accounting for the movement of goods.
The report is filled out manually .
The report period must be selected before the report is recorded. If an incorrect period is selected, you must close the report without saving it and then create a new one.
Yellow cells are filled in manually , data in green cells is calculated automatically based on the information entered into the report.
The form is filled out automatically only for import transactions based on the Application for the import of goods .
More details Is the statistical form of the Federal Customs Service when working with the EAEU in 1C automatically generated only when importing?
After filling out the Statistical form, you should Write it down , then, using the appropriate buttons, you can:
- unload;
- check unloading;
- type;
- send to the Federal Customs Service.
The upload file is checked, among other things, for the correctness of the unit of measurement of the item according to the HS code. Therefore, it is important to fill out the nomenclature card correctly.
The unit of measurement of the nomenclature must correspond to that established by the unified customs tariff of the Eurasian Economic Union in relation to transported goods for a given HS code (Decision of the Council of the Eurasian Economic Commission dated July 16, 2012 N 54).
For example, for this code the unit is par.
The unit of measurement for the Commodity Nomenclature of Foreign Economic Activity may differ from the unit of measurement that is used for accounting for a given nomenclature in the Organization. For example, for some nomenclature items for the HS code the unit of measurement is not established and:
- in the Unit: field of the TN VED classifier, a dash is placed;
- in the Unit: nomenclature card , the accounting unit of measurement is indicated, for example, pcs.
The statistical form is submitted to the customs authorities no later than the 10th working day of the month following the month in which the goods were shipped (received).
The form can be downloaded from 1C and sent from your personal account on the FCS portal >>
For failure to submit or untimely submission of a statistical form for recording the movement of goods to the Federal Customs Service, a fine will be charged (Administrative Code of the Russian Federation, Art. 19.7.13):
- for officials - from 10,000 rubles. up to 15,000 rubles;
- for legal entities – from 20,000 rubles. up to 50,000 rub.
Before filling out the statistical form to customs, we recommend that you read the FCS Letter published on the customs website. It provides answers to frequently asked questions about filling out the statistical form for recording the movement of goods. The letter on the portal is regularly updated.
Did the article help?
Get another secret bonus and full access to the BukhExpert8 help system for 14 days free of charge
Related publications
- From December 30, 2021, statistical reporting is submitted only in electronic form. According to Federal Law dated December 30, 2020 N 500-FZ, which came into force...
- Uploading an XML template and setting up the format for uploading a statistical report to ZUP 3 You do not have access to view To gain access: Complete a commercial...
- Statistical observation form No. 1 for April 2021 (ZUP 3.1.5.442 / 3.1.9.187) You do not have access to view To gain access: Complete a commercial…
- How to get a list of employees who have not submitted an application for the work book format in the form of a report...
Our principles of working with information
Data quality control
The customs database in its original form consists of several tables and contains more than 100 fields with various types of data. Only detailed knowledge of the specifics of customs databases and professional work with a database of tens of millions of records will allow us to convey a statistically correct result to the customer.
Analytical processing
We do additional processing of customs statistics data, giving them clarity, and not just downloading information from the data array. Thanks to this, you will significantly reduce the time required to analyze the information received and make the right decisions. Our reports allow you to get a general idea of the import-export structure of the product you are interested in in just a few minutes.
Maximum data completeness
Integration of FCS statistics with other sources: Rosstat and business directories allows you to obtain more information about participants in foreign economic activity: financial indicators, industry affiliation according to OKVED, full names of managers and their contact information.
Which of the standard reports suits you best - see here.