According to economic theory, a country's trade turnover is almost the most important macroeconomic indicator, because it reflects all internal and external changes in the economy, politics and geography. Through a country’s exports and imports one can see the position of its goods on the world market, through the balance one can see the “success” of the country’s economy, the structure of foreign trade shows the state of individual sectors of the economy, and artifacts in dynamics can show what stress factors have occurred with the country’s economy in one or another another year. For example, the problems of Russian foreign trade that arose after the annexation of Crimea:
| Year | Export, million US dollars | Imports, million US dollars |
| 2010 | 397068 | 228912 |
| 2011 | 516718 | 305760 |
| 2012 | 524735 | 317263 |
| 2013 | 525976 | 315298 |
| 2014 | 497359 | 287063 |
| 2015 | 343512 | 182902 |
| 2016 | 285652 | 182448 |
| 2017 | 357767 | 227464 |
| 2018 | 449564 | 238493 |
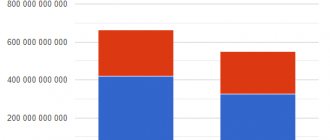
Infographics (export – red, import – green):
As you can see, after the annexation, foreign trade of the Russian Federation slowed down by about 40%, and in 2021 it was still below 2014 levels. This is quite logical - you don’t really want to trade with a country that might start hostilities.
Below you will find the economics of Russian foreign trade in detail: by year, by industry, by individual product. In addition, we will consider in detail import/export with individual countries, including members of the EurAsEC/EAEU.
Foreign trade of Russia
On years
Russia's foreign trade by year:
| Year | Export, million US dollars | Export, % compared to the previous year | Imports, million US dollars | Import, % compared to the previous year | Balance, million US dollars |
| 1995 | 78217 | 123,6 | 46709 | 120,8 | 31508 |
| 1996 | 85189 | 108,9 | 46458 | 99,5 | 38731 |
| 1997 | 85096 | 99,9 | 53123 | 114,3 | 31973 |
| 1998 | 71314 | 83,8 | 43579 | 82,0 | 27735 |
| 1999 | 72885 | 102,2 | 30278 | 69,5 | 42607 |
| 2000 | 103093 | 141,4 | 33880 | 111,9 | 69213 |
| 2001 | 99969 | 97,0 | 41883 | 123,6 | 58086 |
| 2002 | 106712 | 106,7 | 46177 | 110,3 | 60535 |
| 2003 | 133656 | 125,2 | 57347 | 124,2 | 76309 |
| 2004 | 181600 | 135,9 | 75569 | 131,8 | 106031 |
| 2005 | 241473 | 133,0 | 98708 | 130,6 | 142765 |
| 2006 | 301244 | 124,8 | 137807 | 139,6 | 163437 |
| 2007 | 351928 | 116,8 | 199753 | 145,0 | 152175 |
| 2008 | 467581 | 132,9 | 267101 | 133,7 | 200480 |
| 2009 | 301667 | 64,5 | 167348 | 62,7 | 134319 |
| 2010 | 397068 | 131,6 | 228912 | 136,8 | 168156 |
| 2011 | 516718 | 130,1 | 305760 | 133,6 | 210958 |
| 2012 | 524735 | 101,6 | 317263 | 103,8 | 207472 |
| 2013 | 525976 | 100,2 | 315298 | 99,4 | 210679 |
| 2014 | 497359 | 94,6 | 287063 | 91,0 | 210296 |
| 2015 | 343512 | 69,1 | 182902 | 63,7 | 160610 |
| 2016 | 285652 | 83,2 | 182448 | 99,8 | 103204 |
| 2017 | 357767 | 125,2 | 227464 | 124,7 | 130303 |
| 2018 | 449564 | 125,8 | 238493 | 104,7 | 211071 |
Balance statistics by year on the chart:
As you can see, the development of Russian foreign trade did not occur linearly. Despite the fact that since 1995 Russia has made great progress in terms of net earnings from foreign trade, the indicators have “collapsed” more than once. The most serious collapse occurred in 2015-2016, we explained the reasons above. But we would like to note that the balance has already recovered to pre-crisis values, but the volume of trade has not. We will find out what the balance looks like in 2021, 2021 and 2021 at the end of 2021-2023, but we can already say that the balance values will again drop significantly due to the coronavirus crisis.
By type and industry
Export structure by year (in cells – millions of US dollars):
| Export | 2005 | 2006 | 2007 | 2008 | 2009 | 2010 | 2011 | 2012 | 2013 | 2014 | 2015 | 2016 | 2017 | 2018 |
| Total | 241473 | 301244 | 351928 | 467581 | 301667 | 397068 | 516718 | 524735 | 525976 | 497359 | 343512 | 285652 | 357767 | 450277.5 |
| Food and agricultural raw materials | 4492 | 5514 | 9090 | 9278 | 9967 | 8755 | 13330 | 16769 | 16262 | 18982 | 16215 | 17075 | 20699 | 24958 |
| Mineral products | 156372 | 198631 | 228436 | 326314 | 203408 | 271888 | 367635 | 373998 | 375815 | 350266 | 219167 | 169145 | 216184 | 292443 |
| Rubber, chemical industry products | 14367 | 16757 | 20802 | 30234 | 18708 | 24528 | 32633 | 32129 | 30827 | 29246 | 25405 | 20819 | 23972 | 27485 |
| Leather, furs, products made from them | 330 | 367 | 337 | 354 | 242 | 305 | 394 | 518 | 610 | 417 | 311 | 264 | 287 | 255.2 |
| Wood and paper products | 8305 | 9535 | 12263 | 11560 | 8436 | 9574 | 11273 | 10191 | 10987 | 11583 | 9845 | 9807 | 11775 | 13917 |
| Textiles and textile products, shoes | 965 | 967 | 952 | 870 | 716 | 764 | 934 | 770 | 937 | 1101 | 873 | 918 | 1105 | 1223.9 |
| Metals, precious stones and products made from them | 40592 | 48936 | 55963 | 61751 | 38551 | 50343 | 58701 | 58257 | 55080 | 52275 | 40760 | 37558 | 48121 | 53613 |
| Equipment and transport | 13505 | 17437 | 19667 | 22764 | 17879 | 21257 | 26025 | 26553 | 28841 | 26495 | 25422 | 24548 | 28283 | 29227 |
| Other | 2545 | 3101 | 4420 | 4458 | 3761 | — | 5794 | 5551 | 6618 | 6996 | 5513 | 5517 | 7342 | 7156.5 |
Data for 2021 on the infographic:
Export structure by year (in cells – millions of US dollars):
| Import | 2005 | 2006 | 2007 | 2008 | 2009 | 2010 | 2011 | 2012 | 2013 | 2014 | 2015 | 2016 | 2017 | 2018 |
| Total | 98708 | 137807 | 199746 | 267101 | 167348 | 228912 | 305760 | 317263 | 315298 | 287063 | 182902 | 182448 | 227464 | 238710.1 |
| Food and agricultural raw materials | 17430 | 21640 | 27626 | 35189 | 30015 | 36398 | 42535 | 40655 | 43255 | 39957 | 26650 | 25072 | 28924 | 29796.4 |
| Mineral products | 3034 | 3300 | 4681 | 8279 | 4079 | 5193 | 9877 | 7531 | 6936 | 7334 | 4981 | 3237 | 4476 | 5024.5 |
| Rubber, chemical industry products | 16275 | 21787 | 27530 | 35209 | 27872 | 36969 | 46044 | 48611 | 50004 | 46480 | 33989 | 33814 | 40298 | 43579.4 |
| Leather, furs, products made from them | 275 | 434 | 697 | 1038 | 771 | 1244 | 1581 | 1663 | 1531 | 1282 | 822 | 819 | 1130 | 1269.5 |
| Wood and paper products | 3290 | 3964 | 5309 | 6504 | 5103 | 5893 | 6743 | 6241 | 6621 | 5899 | 3631 | 3385 | 3603 | 3920.4 |
| Textiles and textile products, shoes | 3619 | 5494 | 8631 | 11658 | 9544 | 14148 | 16735 | 18047 | 18040 | 16318 | 10847 | 10988 | 13574 | 14887.8 |
| Metals, precious stones and products made from them | 7652 | 10642 | 16382 | 19337 | 11330 | 16795 | 22996 | 23259 | 22631 | 20558 | 12363 | 11898 | 16283 | 17935.8 |
| Equipment and transport | 43436 | 65706 | 101739 | 140759 | 72669 | 101739 | 148068 | 158318 | 152773 | 136580 | 81909 | 86158 | 110460 | 112740.3 |
| Other | 3697 | 4840 | 7152 | 9127 | 5964 | — | 11183 | 12939 | 13507 | 12655 | 7712 | 7078 | 8717 | 9556 |
Data for 2021 on the infographic:
As you can see, the country is most active in selling mineral products and purchasing equipment and transport.
Analysis of Russian exports over the past 10 years has revealed leading directions
The weakest link that we inherited from Soviet industry is the production of consumer goods. It is almost impossible to find high-quality domestic clothing or electronics, and jokes are made about the Russian automobile industry. Therefore, the average consumer can hardly give a decent assessment of the country's industrial production and see its achievements.
Despite all the successful discoveries and results in space exploration, nuclear energy and other fundamental sciences, many are convinced that in Russia they simply cannot invent, much less make, something that would not be embarrassing to offer to the buyer, and then and sell on the world market.
There is no doubt that the lion's share of the domestic budget is oil rent. Thus, an analysis of Russian exports for 2013 showed that the country sold various products worth $526 billion, of which $371 billion was income from the sale of energy resources. Note the $155 billion difference! Did they come from somewhere?! Less than ten years have passed since then, when the entire annual export volume was equal to $133 billion.
The Federal Customs Service informs that in 2021, as in previous years, the main exported goods remained products of the fuel and energy industry (60.7% of the total volume). Although the decrease in supplies also affected this area: the cost of sales decreased by 38.9%, volume - by 0.6%.
So what can Russia offer to the world community, if not coal, oil or gas? The list, in principle, is not so small: wood, grain, ferrous and non-ferrous metals, weapons.
For example, compared to the previous year in 2021, as an analysis of Russian exports shows, grain supplies increased by 14%, amounting to 25 million tons. The country has become a leader among states selling wheat outside its borders.
Grains from the Russian Federation are sent to more than 70 countries, including Turkey, Nigeria, Iran, the Republic of Bangladesh and, of course, Egypt. As for the latter, it is this country that buys the maximum amount of cereals from our farmers. Bloomberg noted that Russia has reached a fundamentally new level in the export of these products and has regained its status as a grain superpower, becoming the world's largest supplier.
An analysis of the dynamics of Russian exports and imports conducted by the International Research Institute showed that the countries that export the maximum amount of weapons remain Russia and the United States. And the Middle East is still our key buyer of these products.
The export of the above goods does not surprise anyone, but quite often foreign trade involves products that no one would even think about. They are the ones who can make you look at the achievements of Russian industry differently.
Read the article: Export-import operations in the Russian economy in 2021
Statistics of export and import of goods
Exports by month, million dollars:
| 2013 | 2014 | 2015 | 2016 | |
| January | 38 989 | 39 564 | 28 086 | 17 631 |
| February | 42 583 | 36 017 | 29 316 | 20 296 |
| March | 44 945 | 47 107 | 32 865 | 23 461 |
| April | 44 628 | 47 679 | 30 868 | 22 021 |
| May | 41 281 | 44 317 | 30 669 | 22 171 |
| June | 42 202 | 40 893 | 30 060 | 24 301 |
| July | 43 771 | 46 095 | 27 328 | 22 735 |
| August | 42 461 | 41 473 | 25 330 | 23 330 |
| September | 45 231 | 38 396 | 26 636 | 25 733 |
| October | 43 876 | 41 506 | 27 433 | 25 278 |
| november | 47 385 | 36 794 | 25 762 | 27 093 |
| December | 49 915 | 37 992 | 29 190 | 31 722 |
Rating of months on the chart:
List of months and imports in millions of dollars for each month:
| 2013 | 2014 | 2015 | 2016 | |
| January | 19 806 | 18 930 | 11 197 | 9 104 |
| February | 24 633 | 22 319 | 14 621 | 12 194 |
| March | 26 609 | 25 658 | 16 214 | 14 729 |
| April | 28 196 | 26 095 | 15 266 | 14 496 |
| May | 24 326 | 24 339 | 14 254 | 13 734 |
| June | 26 098 | 25 076 | 15 272 | 15 284 |
| July | 28 024 | 27 463 | 15 901 | 15 401 |
| August | 25 987 | 23 397 | 15 492 | 17 715 |
| September | 26 263 | 24 140 | 16 135 | 17 129 |
| October | 28 098 | 24 967 | 16 187 | 17 365 |
| november | 27 193 | 21 477 | 15 654 | 16 718 |
| December | 29 734 | 22 809 | 16 527 | 18 477 |
On the infographic:
As you can see, the “hottest” trading begins in December.
There is also a table of imports and exports by year/month and product groups, but we will not provide it - it is too large. If you are interested, the export of individual goods can be found here: https://fedstat.ru/indicator/37393, the import of individual goods can be found here: https://fedstat.ru/indicator/37395.
Trade turnover of Russia
The main imported goods are electrical equipment and machinery, machinery, vehicles, food and agricultural raw materials, and chemical products.
The predominant volume of exports is from the fuel and energy industry (oil, gas), as well as ferrous metals, equipment, mineral fertilizers, and cereals.
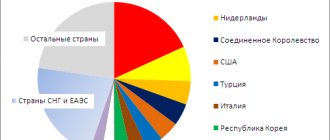
The European Union remains Russia’s main foreign trade partner – more than 50% of the total. 8 and 7.7%, respectively, come from Germany and the Netherlands. Then come the CIS member countries. More than 5% of the total trade turnover is accounted for by trade with Belarus.
Product partners of Russia – analytics of partner countries
Rosstat separately identifies 2 sources of import/export, the first source is non-CIS countries, the second is CIS countries. From the CIS countries, statistics on trade with the EurAsEC/EAEU are kept separately. Export table by country:
| Year | With foreign countries, millions of dollars | With foreign countries, as a percentage of the previous year | With CIS countries, in millions of dollars | With CIS countries, as a percentage of the previous year | With EurAsEC/EAEU countries, millions of dollars | With EurAsEC/EAEU countries, as a percentage of the previous year |
| 1995 | 63687 | 129,4 | 14530 | 103,2 | 5815 | 104,8 |
| 1996 | 69294 | 108,8 | 15895 | 109,4 | 6383 | 109,8 |
| 1997 | 68472 | 98,8 | 16624 | 104,6 | 7401 | 115,9 |
| 1998 | 57614 | 84,1 | 13699 | 82,4 | 6773 | 91,5 |
| 1999 | 62179 | 107,9 | 10707 | 78,2 | 5143 | 75,9 |
| 2000 | 89269 | 143,6 | 13824 | 129,1 | 7974 | 155,0 |
| 2001 | 85352 | 95,6 | 14617 | 105,7 | 8278 | 103,8 |
| 2002 | 91001 | 106,6 | 15711 | 107,5 | 8497 | 102,6 |
| 2003 | 113157 | 124,3 | 20498 | 130,5 | 11172 | 131,5 |
| 2004 | 152129 | 134,4 | 29471 | 143,8 | 16335 | 146,2 |
| 2005 | 208846 | 137,3 | 32627 | 110,7 | 17269 | 105,7 |
| 2006 | 258934 | 124,0 | 42310 | 129,7 | 23004 | 133,2 |
| 2007 | 299267 | 115,6 | 52661 | 124,5 | 30611 | 133,1 |
| 2008 | 397925 | 133,0 | 69656 | 132,3 | 38908 | 127,1 |
| 2009 | 254856 | 64,0 | 46811 | 67,2 | 27363 | 70,3 |
| 2010 | 337467 | 132,4 | 59601 | 127,3 | 30435 | 111,2 |
| 2011 | 437283 | 129,6 | 79435 | 133,3 | 40910 | 134,4 |
| 2012 | 445478 | 101,9 | 79258 | 99,8 | 43133 | 105,4 |
| 2013 | 452036 | 101,5 | 73940 | 93,3 | 40764 | 94,5 |
| 2014 | 433173 | 95,8 | 64186 | 86,8 | 36901 | 90,5 |
| 2015 | 298420 | 68,9 | 45092 | 70,3 | 28564 | … |
| 2016 | 247687 | 83,0 | 37966 | 84,2 | 25870 | 90,6 |
| 2017 | 309688 | 125,0 | 48079 | 126,6 | 33726 | 130,4 |
| 2018 | 394675 | 127,7 | 54889 | 113,9 | 37993 | 112,5 |
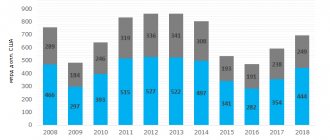
Infographics (red – abroad, blue – CIS, green – EurAsEC/EAEU):
Import table by country:
| Year | With foreign countries, millions of dollars | With foreign countries, as a percentage of the previous year | With CIS countries, in millions of dollars | With CIS countries, as a percentage of the previous year | With EurAsEC/EAEU countries, millions of dollars | With EurAsEC/EAEU countries, as a percentage of the previous year |
| 1995 | 33117 | 116,8 | 13592 | 131,7 | 5128 | 119,9 |
| 1996 | 31909 | 96,4 | 14549 | 107,0 | 6300 | 122,9 |
| 1997 | 38889 | 121,9 | 14234 | 97,8 | 7769 | 123,3 |
| 1998 | 32266 | 83,0 | 11313 | 79,5 | 6684 | 86,0 |
| 1999 | 21935 | 68,0 | 8343 | 73,7 | 4826 | 72,2 |
| 2000 | 22276 | 101,6 | 11604 | 139,1 | 6236 | 129,2 |
| 2001 | 30681 | 137,7 | 11202 | 96,5 | 6169 | 98,9 |
| 2002 | 36014 | 117,4 | 10163 | 90,7 | 6063 | 98,3 |
| 2003 | 44207 | 122,7 | 13139 | 129,3 | 7528 | 124,2 |
| 2004 | 57856 | 130,9 | 17713 | 134,8 | 10140 | 134,7 |
| 2005 | 79712 | 137,8 | 18996 | 107,2 | 9181 | 90,5 |
| 2006 | 115433 | 144,8 | 22374 | 117,8 | 11006 | 119,9 |
| 2007 | 169875 | 147,2 | 29878 | 133,5 | 13955 | 126,8 |
| 2008 | 230494 | 135,7 | 36607 | 122,5 | 17635 | 126,4 |
| 2009 | 145530 | 63,1 | 21818 | 59,6 | 10996 | 62,4 |
| 2010 | 197184 | 135,5 | 31728 | 145,4 | 15010 | 136,5 |
| 2011 | 260920 | 132,3 | 44841 | 141,3 | 21469 | 143,0 |
| 2012 | 272323 | 104,4 | 44941 | 100,2 | 24078 | 112,2 |
| 2013 | 276310 | 101,5 | 38988 | 86,8 | 20392 | 84,7 |
| 2014 | 253776 | 91,8 | 33287 | 85,4 | 20306 | 99,6 |
| 2015 | 161693 | 63,7 | 21210 | 63,7 | 14106 | … |
| 2016 | 162658 | 100,6 | 19790 | 93,3 | 13916 | 98,7 |
| 2017 | 202608 | 124,6 | 24856 | 125,6 | 17801 | 127,9 |
| 2018 | 212026 | 104,5 | 26468 | 105,9 | 18646 | 104,2 |
Infographics (red – abroad, blue – CIS, green – EurAsEC/EAEU):
As can be seen from the data, neither the CIS, nor the EurAsEC/EAEU in particular are the main directions of Russia's trade - the largest share in the volume of trade is made up of far-abroad countries.
Russian exports, 1990-2019
For 1990-2019 Russia's exports at current prices increased by $371.8 billion (4.4 times) to $481.3 billion; the change occurred by -$1.2 billion due to a drop in population by 1.7 million, as well as by $373.0 billion due to an increase in per capita exports by $2,557.3. The average annual growth in Russian exports was at the level of 12.8 billion dollars or 5.2%. The average annual increase in Russian exports in constant prices was 6.9%. The world share decreased by 0.56%. The share in Europe decreased by 0.058%. The minimum export was in 1991 ($78.6 billion). The maximum export was in 2012 ($594.2 billion).
During 1990-2019 Exports per capita in Russia increased by $2,557.3 (4.4 times) to $3,299.3. The average annual growth in exports per capita at current prices was $88.2 or 5.3%.
Changes in Russian exports are described by a linear correlation-regression model: y=16.7x-33 144.5, where y is the estimated value of Russian exports, x is the year. Correlation coefficient = 0.807. Coefficient of determination = 0.65.
Russian exports, 1990-2012 (growth)
During 1990-2012. Russia's exports at current prices increased by $484.7 billion (5.4 times) to $594.2 billion; the change occurred by -$2.6 billion due to a drop in population by 3.5 million, as well as by $487.3 billion due to an increase in exports per capita by $3,384.6. The average annual growth in Russian exports is 22.0 billion dollars or 8.0%. The average annual growth in Russian exports in constant prices was 8.2%. The world share increased by 0.082%. The share in Europe increased by 1.8%.
For the period 1990-2012. Exports per capita in Russia increased by $3,384.6 (5.6 times) to $4,126.6. The average annual growth in exports per capita at current prices is $153.8 or 8.1%.
Russian exports, 2012-2019 (decline)
During 2012-2019 Russia's exports at current prices decreased by $112.9 billion (by 19%) to $481.3 billion; the change occurred by $7.7 billion due to a population increase of 1.9 million, as well as by -$120.7 billion due to a drop in exports per capita by $827.3. The average annual growth in Russian exports is -16.1 billion dollars or -3.0%. The average annual growth in Russian exports in constant prices is 2.9%. The world share decreased by 0.64%. The share in Europe decreased by 1.9%.
During 2012-2019 Exports per capita in Russia decreased by $827.3 (20%) to $3,299.3. The average annual growth in exports per capita at current prices was -$118.2 or -3.1%.
Export of Russia, 1990
Russia's exports in 1990 amounted to $109.5 billion, ranking 10th in the world and at the level of Swiss exports ($108.7 billion). Russia's exports were higher than Russia's imports by $0.26 billion, and the trade surplus was equal to 0.046% of Russia's GDP. The share of Russia's exports in the world was 2.5%.
Exports per capita in Russia in 1990 amounted to $742.0, ranked 92nd in the world and were at the level of exports per capita in Slovakia ($758.7), exports per capita in South Africa ($741.1), exports per capita in Jordan ($714.3), exports per capita in Yugoslavia ($707.7), exports per capita in Costa Rica ($696.4). Exports per capita in Russia were less than exports per capita in the world ($819.7) by $77.7.
Comparison of exports of Russia and its neighbors in 1990. Russia's exports were greater than China's exports ($55.3 billion) by 98%, Finland's exports ($31.3 billion) by 3.5 times, Ukraine's exports ($24.9 billion) by 4.4 times, Belarus' exports ($8.7 billion). . dollars) by 12.7 times, exports of Kazakhstan (2.3 billion dollars) by 47.6 times, exports of Mongolia (0.2 billion dollars) by 463.8 times, but were less than exports of Japan (320.2 billion dollars) by 65.8 %. Exports per capita in Russia were greater than exports per capita in Ukraine ($484.5) by 53.2%, exports per capita in Kazakhstan ($140.4) by 5.3 times, exports per capita in Mongolia ($108.1) by 6.9. times, exports per capita in China ($47.0) by 15.8 times, but were less than exports per capita in Finland ($6,269.6) by 88.2%, exports per capita in Japan ($2,571.5) by 71.1% , exports per capita in Belarus ($852.4) by 12.9%.
Comparison of Russian exports and leaders in 1990. Russia's exports were less than US exports ($551.9 billion) by 80.2%, German exports ($404.6 billion) by 72.9%, Japanese exports ($320.2 billion) by 65.8%, French exports ($266.2 billion). $) by 58.9%, UK exports ($252.2 billion) by 56.6%. Exports per capita in Russia were less than exports per capita in Germany ($5,117.7) by 85.5%, exports per capita in France ($4,571.2) by 83.8%, exports per capita in the UK ($4,414.6) ) by 83.2%, exports per capita in Japan ($2,571.5) by 71.1%, exports per capita in the USA ($2,188.9) by 66.1%.
Russia's export potential in 1990. With per capita exports at the same level as Finland's per capita exports ($6,269.6), its best neighbor, Russia's exports would be $925.0 billion, 8.4 times the actual level. With exports per capita at the same level as Germany's exports per capita ($5,117.7), Russia's exports would be $755.1 billion, which is 6.9 times the actual level. With per capita exports at the same level as Europe's per capita exports ($3,076.1), Russia's exports would be $453.8 billion, which is 4.1 times the actual level. With exports per capita at the same level as exports per capita in the world ($819.7), Russia's exports would be $120.9 billion, which is 10.5% more than the actual level.
Export of Russia, 2012
Russia's exports in 2012 were equal to 594.2 billion dollars, ranked 9th in the world and were at the level of exports of Italy (592.3 billion dollars), exports of Singapore (580.5 billion dollars), exports of Hong Kong (566.9 billion dollars). .), Canadian exports ($555.1 billion). Russia's exports exceeded Russia's imports by $147.1 billion, and the trade surplus amounted to 6.7% of Russia's GDP. The share of Russia's exports in the world was equal to 2.6%.
Exports per capita in Russia in 2012 amounted to $4,126.6, ranked 84th in the world and was at the level of exports per capita in Thailand ($4,088.4), exports per capita in Tahiti ($4,079.9), exports per capita population in Azerbaijan ($3,984.2), exports per capita in Uruguay ($3,932.5). Exports per capita in Russia were higher than exports per capita in the world ($3,220.8) by $905.8.
Comparison of exports of Russia and its neighbors in 2012. Russia's exports were greater than the exports of Finland ($100.2 billion) by 5.9 times, the exports of Kazakhstan ($91.7 billion) by 6.5 times, the exports of Ukraine ($83.9 billion) by 7.1 times, the exports of Belarus ($51.7 billion). dollars) by 11.5 times, Mongolia's exports ($5.4 billion) by 110.9 times, but was less than China's exports ($2,175.1 billion) by 72.7%, Japan's exports ($902.2 billion) by 34.1%. Exports per capita in Russia were greater than exports per capita in Mongolia ($1,896.3) by 2.2 times, exports per capita in Ukraine ($1,845.4) by 2.2 times, exports per capita in China ($1,571.4 ) by 2.6 times, but was less than exports per capita in Finland ($18,513.1) by 77.7%, exports per capita in Japan ($7,025.6) by 41.3%, exports per capita in Belarus ($5,494.7 ) by 24.9%, exports per capita in Kazakhstan ($5,477.1) by 24.7%.
Comparison of Russian exports and leaders in 2012. Russia's exports were less than US exports ($2,191.3 billion) by 72.9%, Chinese exports ($2,175.1 billion) by 72.7%, German exports ($1,633.4 billion) by 63.6%, Japanese exports ($902.2 billion) by 34.1%, UK exports ($810.9 billion) by 26.7%. Exports per capita in Russia were greater than exports per capita in China ($1,571.4) by 2.6 times, but were less than exports per capita in Germany ($20,172.3) by 79.5%, exports per capita in Great Britain ($12,566.6) by 67.2%, exports per capita in Japan ($7,025.6) by 41.3%, exports per capita to the USA ($6,977.7) by 40.9%.
Russia's export potential in 2012. With per capita exports at the same level as Germany's per capita exports ($20,172.3), Russia's exports would be $2,904.6 billion, which is 4.9 times the actual level. With per capita exports at the same level as Finland's best neighbor ($18,513.1), Russia's exports would be $2,665.7 billion, 4.5 times the actual level. With exports per capita at the same level as exports per capita in Europe ($11,895.8), Russia's exports would be $1,712.9 billion, which is 2.9 times the actual level. With exports per capita at the same level as Eastern Europe's per capita exports ($4,767.8), Russia's exports would be $686.5 billion, which is 15.5% more than the actual level.
Export of Russia, 2019
Russia's exports in 2021 were equal to 481.3 billion dollars, ranked 18th in the world and were at the level of exports of Ireland ($502.5 billion), exports of Mexico ($492.7 billion), exports of Spain ($486.2 billion). ), Swiss exports ($482.8 billion). Russia's exports exceeded Russia's imports by $128.6 billion, and the trade surplus amounted to 7.6% of Russia's GDP. The share of Russia's exports in the world was 1.9%.
Exports per capita in Russia in 2021 amounted to $3,299.3, ranked 94th in the world and was at the level of exports per capita in Uruguay ($3,517.1), exports per capita in Suriname ($3,211.3), exports per capita population in Dominica ($3,110.7). Exports per capita in Russia were higher than exports per capita in the world ($3,208.4) by $90.9.
Comparison of exports of Russia and its neighbors in 2021. Russia's exports were greater than the exports of Finland ($108.2 billion) by 4.4 times, the exports of Kazakhstan ($65.8 billion) by 7.3 times, the exports of Ukraine ($63.3 billion) by 7.6 times, the exports of Belarus ($41.9 billion). dollars) by 11.5 times, Mongolia's exports ($8.5 billion) by 56.6 times, but was less than China's exports ($2,690.4 billion) by 82.1%, Japan's exports ($889.0 billion) by 45.9%. Exports per capita in Russia were greater than exports per capita in Mongolia ($2,634.5) by 25.2%, exports per capita in China ($1,876.5) by 75.8%, exports per capita in Ukraine ($1,439.4 ) by 2.3 times, but was less than exports per capita in Finland ($19,558.1) by 83.1%, exports per capita in Japan ($7,008.0) by 52.9%, exports per capita in Belarus ($4,433.6 ) by 25.6%, exports per capita in Kazakhstan ($3,548.7) by 7%.
Comparison of Russian exports and leaders in 2021. Russia's exports were less than China's exports ($2,690.4 billion) by 82.1%, US exports ($2,514.8 billion) by 80.9%, German exports ($1,810.6 billion) by 73.4%, Japan's exports ($889.0 billion) by 45.9%, UK exports ($881.8 billion) by 45.4%. Exports per capita in Russia were greater than exports per capita in China ($1,876.5) by 75.8%, but were less than exports per capita in Germany ($21,679.5) by 84.8%, exports per capita in Great Britain ($13,057.7) by 74.7%, exports per capita to the USA ($7,642.1) by 56.8%, exports per capita to Japan ($7,008.0) by 52.9%.
Russia's export potential in 2021.
With per capita exports at the same level as Germany's per capita exports ($21,679.5), Russia's exports would be $3,162.3 billion, which is 6.6 times the actual level. With per capita exports at the same level as Finland's best neighbor ($19,558.1), Russia's exports would be $2,852.9 billion, 5.9 times the actual level. With exports per capita at the same level as exports per capita in Europe ($13,192.9), Russia's exports would be $1,924.4 billion, which is 4.0 times the actual level. With exports per capita at the same level as Eastern Europe's per capita exports ($5,054.3), Russia's exports would be $737.3 billion, which is 53.2% more than the actual level. Russian exports, 1990-2019
| year | exports, billion dollars | export per capita, dollars | exports, billion dollars | export growth, % | share of exports in GDP, % | Russia's share, % | ||
| current prices | constant prices 1990 | in the world | in Europe | in Eastern Europe | ||||
| 1990 | 109.5 | 742.0 | 109.5 | 19.1 | 2.5 | 4.9 | 54.2 | |
| 1991 | 78.6 | 530.9 | 297.1 | 171.4 | 13.9 | 1.7 | 3.5 | 48.5 |
| 1992 | 322.7 | 2 176.4 | 237.7 | -20.0 | 65.5 | 6.3 | 12.3 | 77.7 |
| 1993 | 184.9 | 1 246.0 | 232.7 | -2.1 | 40.1 | 3.7 | 7.9 | 66.5 |
| 1994 | 119.8 | 807.4 | 244.1 | 4.9 | 29.1 | 2.2 | 4.8 | 53.5 |
| 1995 | 117.0 | 789.4 | 261.7 | 7.2 | 29.1 | 1.8 | 3.9 | 46.9 |
| 1996 | 102.2 | 690.7 | 271.4 | 3.7 | 25.9 | 1.5 | 3.3 | 43.1 |
| 1997 | 100.1 | 677.9 | 270.1 | -0.48 | 24.6 | 1.4 | 3.2 | 41.4 |
| 1998 | 84.6 | 574.2 | 275.2 | 1.9 | 31.0 | 1.2 | 2.6 | 35.7 |
| 1999 | 84.7 | 576.3 | 306.1 | 11.2 | 42.9 | 1.2 | 2.6 | 36.6 |
| 2000 | 114.4 | 781.8 | 335.3 | 9.5 | 43.7 | 1.4 | 3.4 | 41.2 |
| 2001 | 113.1 | 775.9 | 349.4 | 4.2 | 36.6 | 1.5 | 3.3 | 38.7 |
| 2002 | 121.7 | 837.7 | 385.3 | 10.3 | 35.0 | 1.5 | 3.3 | 37.6 |
| 2003 | 151.7 | 1 049.0 | 434.0 | 12.6 | 34.9 | 1.6 | 3.5 | 37.2 |
| 2004 | 203.4 | 1 411.8 | 485.2 | 11.8 | 34.1 | 1.8 | 3.9 | 37.3 |
| 2005 | 269.0 | 1 872.1 | 516.5 | 6.5 | 34.9 | 2.1 | 4.6 | 40.5 |
| 2006 | 333.9 | 2 328.6 | 554.4 | 7.3 | 33.4 | 2.2 | 5.1 | 40.9 |
| 2007 | 392.0 | 2 736.5 | 589.1 | 6.3 | 29.9 | 2.3 | 5.1 | 38.7 |
| 2008 | 520.0 | 3 630.2 | 592.6 | 0.59 | 31.0 | 2.6 | 6.0 | 40.7 |
| 2009 | 341.6 | 2 383.3 | 564.5 | -4.7 | 27.7 | 2.1 | 5.0 | 36.7 |
| 2010 | 445.5 | 3 105.0 | 604.3 | 7.0 | 28.9 | 2.3 | 5.8 | 39.6 |
| 2011 | 574.0 | 3 994.3 | 606.2 | 0.31 | 28.0 | 2.5 | 6.3 | 41.0 |
| 2012 | 594.2 | 4 126.6 | 614.5 | 1.4 | 26.9 | 2.6 | 6.7 | 42.3 |
| 2013 | 592.5 | 4 105.2 | 642.5 | 4.6 | 25.8 | 2.5 | 6.5 | 41.2 |
| 2014 | 558.3 | 3 859.1 | 645.7 | 0.50 | 27.1 | 2.3 | 5.9 | 39.0 |
| 2015 | 391.4 | 2 699.2 | 669.4 | 3.7 | 28.6 | 1.8 | 4.7 | 33.8 |
| 2016 | 330.1 | 2 272.4 | 690.6 | 3.2 | 25.8 | 1.6 | 4.0 | 29.6 |
| 2017 | 410.7 | 2 822.2 | 725.3 | 5.0 | 26.0 | 1.8 | 4.5 | 31.5 |
| 2018 | 509.5 | 3 496.2 | 765.5 | 5.5 | 30.5 | 2.0 | 5.1 | 33.7 |
| 2019 | 481.3 | 3 299.3 | 749.5 | -2.1 | 28.4 | 1.9 | 4.9 | 32.4 |
Comparison with statistics from other countries
Top 10 countries by balance for 2009:
| Place | A country | Balance, million dollars | % of GDP |
| 1 | Germany | 217 000 | 6.6 |
| 2 | China | 199 000 | 3.5 |
| 3 | Russia | 139 400 | 9.4 |
| 4 | Saudi Arabia | 136 130 | 31.3 |
| 5 | Japan | 128 400 | 2.4 |
| 6 | Netherlands | 63 900 | 8.0 |
| 7 | Norway | 62 980 | 15.2 |
| 8 | The Republic of Korea | 48 400 | 4.9 |
| 9 | Ireland | 45 340 | 21.8 |
| 10 | Kuwait | 44 670 | 38.1 |
Russia is in third place in terms of income from trade, behind Germany and China. The USA, by the way, is in last place in terms of balance - the country’s imports far exceed its exports, the US balance: -660,000 million dollars.
Comparison of exports of Russia and neighboring countries
Exports of Russia and neighboring countries, the order of relation to the Russian indicator
| A country | 1990 | 2000 | 2010 | 2019 |
| China | -0.30 | 0.39 | 0.56 | 0.75 |
| Japan | 0.47 | 0.66 | 0.28 | 0.27 |
| Russia | 0.0 | 0.0 | 0.0 | 0.0 |
| Finland | -0.54 | -0.34 | -0.67 | -0.65 |
| Kazakhstan | -1.7 | -1.0 | -0.83 | -0.86 |
| Ukraine | -0.64 | -0.77 | -0.84 | -0.88 |
| Belarus | -1.1 | -1.2 | -1.2 | -1.1 |
| Mongolia | -2.7 | -2.3 | -2.1 | -1.8 |
Export per capita in Russia and neighboring countries, relation to the Russian indicator
| A country | 1990 | 2000 | 2010 | 2019 |
| Finland | 8.4 | 13.0 | 5.7 | 5.9 |
| Japan | 3.5 | 5.2 | 2.1 | 2.1 |
| Belarus | 1.1 | 0.87 | 1.0 | 1.3 |
| Kazakhstan | 0.19 | 0.89 | 1.3 | 1.1 |
| Russia | 1.0 | 1.0 | 1.0 | 1.0 |
| Mongolia | 0.15 | 0.32 | 0.40 | 0.80 |
| China | 0.063 | 0.28 | 0.38 | 0.57 |
| Ukraine | 0.65 | 0.51 | 0.45 | 0.44 |
FAQ
- Almost 10% of Russia's GDP comes from international trade. Is it good or bad? Depends on the situation. On the one hand, a large income (10% of GDP) from foreign trade is an “addition” to its own GDP, the country becomes significantly richer. On the other hand, crises, pandemics and other global problems hit the country’s economy harder, a significant part of its income comes from international trade.
- Where did you get the information? Rosstat, database of the Federal Statistics Service.
Analysis of Russian exports to CIS countries
32.6% of the total volume of Russian exports is fuel and energy. After the fall in oil and gas prices and the reduction in supplies of energy resources and fuel to Belarus and Ukraine, both physical (by 8.7%) and monetary (by 31.2%) volumes of external sales of hydrocarbon resources decreased: the number of electricity, 16.6% – natural gas, 3.8% – oil and petroleum products.
An analysis of Russian exports shows that due to the reduction in trade turnover between our country and other CIS countries, the value of sales of products from engineering plants and equipment decreased by 15.8%. External sales of ground transport fell especially sharply (by 43.7%).
The reduction in supplies has not spared the domestic metallurgical industry. In the entire volume of foreign trade, the share of metals is 11.7%. And here, an analysis of Russian exports shows: cost indicators for ferrous metals decreased by 9.8%, and physical indicators by 7.8%, and the level of sales of non-ferrous metals and copper increased by 6.3%. Naturally, the profits of the metallurgical industry were also negatively affected by the fall in world prices.
We can note the success of the development of the chemical production industry; exports of products here increased by 9.4%. Moreover, value volumes decreased by 4%. In this product group, fertilizers are in particular demand, sales of which increased by 20.8% of total industry sales. These products began to be used well not only within the country, which is associated with the intensive development of agriculture, but also in the CIS, where they began to pay quite a lot of attention to this industry.
European Union
The recovery of Russian foreign trade with the European Union (EU) after the global financial and economic crisis of 2009 was quite rapid (Figure 3). Already in 2013, the historically maximum indicator of trade turnover between Russia and the EU was recorded - $374 billion. After 2014, the development of trade and economic relations between EU member states and Russia was influenced by sanctions imposed by Western countries against individual Russian companies and citizens, as well as Russia’s retaliatory measures regarding the import of certain types of products from European countries. This negative political background affected the volume of bilateral trade between Russia and individual European countries. Thus, in 2016, Russia’s foreign trade turnover with the EU decreased by 47%, and with some of its members - even more, for example, with Spain - by 61%.
In general, from 2001 to 2021, the share of the EU in Russian imports decreased from 41.7% to 34.1%, and the share of this group of countries in Russian exports decreased from 50.1% to 33.9%. The impact of the pandemic has also affected Russia's trade with the EU. In 2021, exports to this group of countries decreased by $63 billion, and imports decreased by $6 billion.
Figure 3. Dynamics of Russian foreign trade with the EU (27), 2001-2020. (2021 forecast), billion dollars
Source: compiled by the author based on data from Trade Map - Trade statistics for international business development.
Germany, despite the reduction from 2001 to 2021 of its share in Russian exports from 9.2% to 5.5% and imports from 13.9% to 10.1%, retains its position as Russia’s main foreign economic partner in the EU . Impacted by the pandemic, the country's 2021 value fell 6.4% to $19.4 billion, just half the country's 2012 peak.
In addition to Germany, the main buyers of Russian products in the EU were the Netherlands - 7.4% of Russian exports, Italy - 3%, Poland - 2.8%, Finland - 2.1%. Among Russia's European import partners, the most important in 2021 were Italy - 4.4%, France - 3.6%, Poland - 2.3%, the Netherlands - 1.6%, Czech Republic - 1.3%, Spain - 1.2%.
CIS
Nikitay Smagin: Iran’s trade with the EAEU and prospects for its development
In accordance with the Foreign Economic Strategy of the Russian Federation until 2021, “The development of bilateral and multilateral cooperation with CIS member states is a priority direction of foreign economic policy.” However, despite the high political will of the Russian government, the state of foreign trade relations with some of these countries indicates the unviability of this integration model in the current conditions. In 2001, Russia’s partner states in the CIS accounted for 26.7% of Russian imports, and in 2021 - only 10.9%. The share of this group of countries in Russian exports in 2021, with minor fluctuations during the analyzed period, remained at the 2001 level, that is, about 14.5%.
The decline in Russia's foreign trade with the CIS is primarily due to Ukraine, which, for political reasons, has ceased to play the role of one of the main suppliers of goods to the Russian market. In 2001, it accounted for 9.2% of Russia's imports, and in 2021 - only 1.6%. The participation of Belarus and Kazakhstan in Russian imports is unstable, but overall their share has decreased over two decades. In 2001, Belarus accounted for 9.4%, and in 2020 - only 4.8% of Russian imports. Over the years, Belarus' share in Russian exports has remained almost unchanged and amounts to about 5.4%. Over the past 20 years, Kazakhstan has slightly lost its participation in Russian imports: its share decreased slightly - from 4.8% to 4.2%, and in exports - from 2.8% to 2.2%.
It is obvious that in the future strategy the priority direction of foreign economic activity will no longer be the CIS, but the Eurasian Economic Union (EAEU), the effectiveness of the model of which is confirmed by growth in 2015–2019. by 35% of the mutual trade turnover of its member countries.
Export of gas, oil, grain from Russia (Federal Customs Service data)
| Name of product | Volume in 2021, dollars | Volume in 2021, dollars |
| Crude oil | 93.3 billion | 129.0 billion |
| Petroleum products | 58.2 billion | 78.1 billion |
| Natural gas | 38.1 billion | 49.1 billion |
| cars and equipment | 28.0 billion | 29.0 billion |
| Diesel fuel | 23.2 billion | 33.1 billion |
| Black metals | 18.7 billion | 23.3 billion |
| Coal | 13.5 billion | 17.0 billion |
| Wheat and meslin | 5.7 billion | 8.4 billion |
| Wood and materials | 5.4 billion | 5.9 billion |
| Aluminum | 5.4 billion | 5.3 billion |
| Passenger cars | 1.3 billion | 1.2 billion |
| Trucks | 0.3 billion | 0.3 billion |
| Electricity | 0.6 billion | 0.8 billion |
| Vodka | 0.1 billion | 0.1 billion |
The economy may have to be saved through gas supplies. In 2018, gas exports from Russia amounted to $49 billion. This is $11 billion more than in 2021. Also last year, we exported ferrous metals worth $23 billion, forests – $5.9 billion, wheat – $8.4 billion.
Comparing Russia's exports over the years, it should be noted that in the first month of 2021, the export volume amounted to $31.6 billion. A fairly vigorous start to the year, which allows us to hope for good results
Russia's imports by year (2000-2019)
| Period | Import volume, dollars |
| January 2021 | 15.6 billion |
| 2018 | 240.5 billion |
| 2017 | 228.5 billion |
| 2016 | 182.2 billion |
| 2015 | 182.9 billion |
| year 2014 | 287.0 billion |
| year 2013 | 315.2 billion |
| year 2012 | 317.2 billion |
| 2011 | 305.7 billion |
| 2010 | 228.9 billion |
| year 2009 | 167.3 billion |
| 2008 | 267.1 billion |
| 2007 | 199.7 billion |
| 2006 | 137.8 billion |
| 2005 year | 98.7 billion |
| 2004 | 75.5 billion |
| 2003 | 57.3 billion |
| 2002 | 46.1 billion |
| year 2001 | 41.8 billion |
| year 2000 | 33.8 billion |
The economy's dependence on energy supplies has a negative impact on GDP dynamics, which in turn affects household incomes. The poverty situation today is striking in its scale. For millions of citizens, the only way to get through the month was through loans without refusal. Loans are available from the age of 18, even to students. You can take money in a matter of minutes without certificates, guarantors or collateral.
Loading …
Export to individual countries and groups of countries
| Region | Export volume in January 2021, dollars |
| EU | 15.3 billion |
| China | 4.0 billion |
| Türkiye | 1.6 billion |
| Belarus | 1.4 billion |
| USA | 0.7 billion |
| Kazakhstan | 0.7 billion |
| Uzbekistan | 0.2 billion |
| Ukraine | 0.4 billion |
While we most often export raw materials and resources, imports mainly consist of purchases of machinery and equipment. This import item accounts for $112 billion. All other types of goods are too far from the leader in the import structure, although the country also imports medicines, cars, clothing, etc.
USA
Vladislav Belov: Russia - European Union: no change on the Western economic front?
Despite the difficult period in bilateral relations between Russia and the United States, one of the areas where a pragmatic approach traditionally prevails is trade and economic ties. This is facilitated by the high interest of business in the two countries in continuing mutually beneficial cooperation, even despite restrictions and non-tariff barriers.
Supplies of goods from the United States continue to occupy one of the main places in Russian imports, their share in 2001 was 7.8%, and 20 years later - 5.7%. The maximum amount of imports from the United States in the last decade was recorded in 2014 - $18.6 billion. Under the influence of sanctions, American supplies to Russia in 2015 decreased by 42%. In subsequent years, there was a gradual restoration of imports from the United States and, despite the pandemic, its size in 2020 amounted to $13.3 billion. Imports from the United States include aircraft, engines, vehicles and their components, as well as machine tools, agricultural products, excavators and equipment for drilling and oil production, industrial, agricultural, measuring, medical equipment.
Russia's exports to the United States over the 20-year period followed the same trend as imports in relative terms, but in 2021 they fell by 15.4% due to the pandemic. In monetary terms, exports grew from $4.2 billion in 2001 to $15.6 billion in 2015. After several years of decline, in 2021 Russian exports to the United States rose to $13.2 billion, and by 50% of it consisted of oil, petroleum products and fuel oil. In addition, a significant share in its structure was made up of semi-finished steel, precious metals, chemical fertilizers, nuclear fuel, and aluminum products.
Import of key goods to Russia (Federal Customs Service data)
| Name of product | Volume in 2021, dollars | Volume in 2021, dollars |
| cars and equipment | 110.2 billion | 112.6 billion |
| Medicines | 8.5 billion | 8.0 billion |
| Passenger cars | 6.6 billion | 7.2 billion |
| Cloth | 6.5 billion | 7.0 billion |
| Meat | 2.0 billion | 1.4 billion |
| Fish | 1.1 billion | 1.2 billion |
| Citrus | 1.1 billion | 1.2 billion |
| Beverages | 2.4 billion | 2.6 billion |
| Shoes | 1.5 billion | 1.7 billion |
| Trucks | 1.9 billion | 1.9 billion |
| Furniture | 1.6 billion | 1.9 billion |
Imports, as a rule, grow behind exports. In 2011-2013, simultaneously with the growth of exports, the volume of imports also jumped, amounting to $305-317 billion. In 2021, we imported goods worth $240.5 billion, and in January 2021 – $15.6 billion.