Occupying Northern Asia and a significant part of Eastern Europe, the Russian Federation is the largest state in the world by area. This may be one of the reasons why energy continues to dominate the share of exports. The dependence of the country's economy on natural resources, in particular gas and oil, cannot be disputed: this fact is mercilessly demonstrated by the official statistics of Russian exports and imports in 2021.
We dived into the analysis of Rosstat data to demonstrate the peculiarities of Russia's imports and exports. In the article you will learn which goods form both directions of trade, which countries are the key partners of the Russian Federation, how trade turnover has changed in recent years.
Let's see how the indicators have changed since 2000.
Export and import of Russia since 2000
| Year 20_ | Total import amount, million $ | Total export amount, $ million |
| 00 | 33880 | 103093 |
| 01 | 41883 | 99969 |
| 02 | 46177 | 106712 |
| 03 | 57347 | 133656 |
| 04 | 75569 | 181600 |
| 05 | 98708 | 241473 |
| 06 | 137807 | 301244 |
| 07 | 199746 | 351928 |
| 08 | 267101 | 467581 |
| 09 | 167348 | 301667 |
| 10 | 228912 | 397068 |
| 11 | 305760 | 516718 |
| 12 | 317263 | 524735 |
| 13 | 315298 | 525976 |
| 14 | 287063 | 497359 |
| 15 | 182902 | 343512 |
| 16 | 182448 | 285652 |
| 17 | 227464 | 357767 |
| 18 | 359100 | 240500 |
| January-August 19 | 271000 | 161800 |
The table shows that the total volume of foreign trade turnover, export and import indicators are growing.
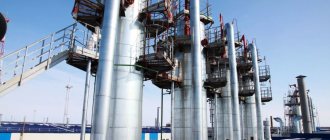
Export of goods from Russia: diagrams, documents, registration
Currently, exporting goods from Russia is a popular area of business development , an opportunity to expand your market for goods, thereby increasing sales volumes, and, consequently, company profits. However, foreign trade activities have their pitfalls. It is better to entrust the procedure for exporting goods to professionals in the field of customs clearance -.
Scheme of work with Russian companies
You have a client abroad who is interested in purchasing your product. However, your company has never worked in the field of foreign trade or, for other reasons, cannot independently export goods. In this case, he can help you solve any problems. We offer two most common work schemes: “contract holder” and “agency support”, depending on your experience and the country of export of goods.
“Contract holder” is a comprehensive service , according to which our company, on your instructions and on its own behalf, exports goods, therefore, all risks also fall on us. The work flow is as follows:
- We buy your goods under a Russian sales contract;
- We prepare all necessary documents for export;
- We customize the goods;
- We deliver to foreign buyers;
- We report to the tax service on the completion of a foreign trade transaction.
Thus, export occurs through our company, the location of the cargo does not matter, we will clear customs and ship the cargo from any city in Russia.
“Agency support” is the provision of comprehensive customs clearance services under your contract; the main advantage of this option is the transparency of payments. AGAPAS-EXPORT specialists will help resolve any issues that may arise.
- Assistance in drawing up a contract;
- Checking incoming and outgoing documentation;
- Determination of the code according to the Commodity Nomenclature of Foreign Economic Activity of the EAEU;
- Registration of all necessary permits (certificates of origin of goods, conclusion on dual use, veterinary and phytosanitary certificates, examination reports, etc.);
- Registration of your company at the customs post;
- Submitting an export declaration.
Our company’s employees will try to do everything possible to successfully complete the export transaction and solve your problems.
Scheme of working with foreign companies
Your company is located outside the Russian Federation and is planning to purchase goods in Russia. However, quite often Russian suppliers refuse to work for export for various reasons, primarily related to the difficulties of customs clearance.
In order not to waste precious time searching for a new Supplier, he will settle all issues with the Russian side. Concluding an international contract with our company will allow you to purchase products from various Russian suppliers from different cities in Russia. We will purchase the goods you are interested in and our specialists will complete all customs formalities as quickly as possible and deliver the goods to you.
Export registration
Exporting goods requires strict adherence to customs clearance rules, as well as the formation of the necessary package of documents. The success of a transaction primarily depends on the professionalism of the specialist. Errors in declarations may result in delay of goods during customs control, and therefore financial costs. will ensure error-free customs clearance of exports and deliver within the agreed time frame.
Even if you intend to export goods yourself, we are ready to advise on certain issues.
Benefits of working with
- Contacting our company will significantly reduce the cost of maintaining the foreign economic activity department. If your company does not export more than 2 times a month, it is more profitable to work with us.
- Customs clearance always requires up-to-date knowledge; our employees have extensive experience in various deliveries and are professionals in their field.
- Our company is focused on long-term cooperation, so we always offer the best option and advise at all stages of a foreign trade transaction.
- Contacting our company will provide you with new competitive advantages in the development of your company. We have a system of discounts for regular customers.
You can receive advice and more detailed information on exporting from Russia by phone or by leaving a request on our website.
Trade turnover of Russia
The main imported goods are electrical equipment and machinery, machinery, vehicles, food and agricultural raw materials, and chemical products.
The predominant volume of exports is from the fuel and energy industry (oil, gas), as well as ferrous metals, equipment, mineral fertilizers, and cereals.
The European Union remains Russia’s main foreign trade partner – more than 50% of the total. 8 and 7.7%, respectively, come from Germany and the Netherlands. Then come the CIS member countries. More than 5% of the total trade turnover is accounted for by trade with Belarus.
Corn
Last year, grain accounted for a third of all supplies of food and agricultural products abroad. Russia exported 49 million tons of grain worth $10 billion. In physical terms this is a quarter more than a year earlier, and in monetary terms - by 29%.
According to the head of the head of the analytical Igor Pavensky, from July 2021 to January 2021. our country sold 29 million tons of wheat abroad. This is a record. In January alone, the Russian Federation exported 3.2 million tons of wheat, which is also a record for shipments for this month and one and a half times more than in January last year, said Dmitry Rylko, General Director of the Institute of Agricultural Market Studies.
Russia Day. Top 5 Russian products that are loved abroad Read more
Volume of exports and imports for January-August 2021
| Amount, million $ | |
| General | 429,2 |
| European Union, total amount | 180 |
| Great Britain | 9,3 |
| Finland | 9,3 |
| France | 9 |
| APEC countries | 136,6 |
| China | 70 |
| Korea | 16,7 |
| United States | 17,4 |
| Japan | 13,2 |
| Türkiye | 17,6 |
| Switzerland | 4,1 |
| countries of the Commonwealth of Independent States, total amount | 51,8 |
| Azerbaijan | 2 |
| EAEU countries, total amount | 36,4 |
| Belarus | 21,4 |
| Kazakhstan | 12,5 |
| Ukraine | 8,3 |
In terms of trade turnover, the top 10 countries include: China, Germany, the Netherlands, Belarus, Italy, Turkey, USA, Poland, Japan, Kazakhstan.
Export to Russia
If we analyze Russian exports in the period 2000-2019, we can note some stability. This applies to volumes, which change by no more than 50-100 billion per year (as a rule, in the direction of growth), and the commodity structure of exports, and key partners.
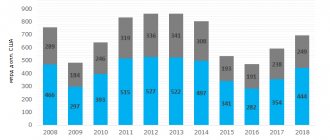
Russia's exports jumped significantly in 2008 (mainly due to the export of petroleum products, which is easy to guess); in 2021, the share of exports decreased by 117.3 billion compared to the previous year.
According to the Russian Bank and statistics provided by the National Research University Higher School of Economics, the value of Russian exports fell by 2%.
Ice cream
If there is nothing surprising in the record volumes of exported grain - after all, historically Russia fed other countries with grains, then the popularity of our ice cream abroad (and even in such distant countries as the USA) no longer seems so obvious.
Over the past five years, Russian ice cream exports have doubled - from 13 thousand tons in 2015 to 26 thousand tons last year. And the number of countries that buy ice cream has grown from 24 to 35. The Russian Federation is among the top 20 world exporters of the dessert.
In the first quarter of this year, Americans imported almost $5 million worth of Russian ice cream. According to Agroexport, 1.9 thousand tons of Russian dessert were sold to the States. As a result, the United States became the largest buyer of our ice cream. In second place is China, which purchased $2.6 million worth of ice cream, which is 66% more than a year earlier. But in terms of physical volumes of imports of Russian ice cream, Kazakhstan ranks second - in January and February, 986 tons of the delicacy were supplied to the republic, and 576 tons to China. Russian ice cream is also bought in Mongolia - for 1.4 million dollars (559 tons from January to March, which is 54% more than a year earlier) and in Ukraine (260 tons for 692 thousand dollars, which is 31% more than in the same period in 2021). In total, in the first quarter, our country sold 5.6 thousand tons of ice cream abroad (+13%) for $14 million (+61%).
“They bring Russian chocolate and marshmallows here.” How the USA and China are taking Africa away from us Read more
Russian exports from 2000 to 2021
| Period, year | Total exports, million $ |
| 2000 | 103093 |
| 2001 | 99969 |
| 2002 | 106712 |
| 2003 | 133656 |
| 2004 | 181600 |
| 2005 | 241473 |
| 2006 | 301244 |
| 2007 | 351928 |
| 2008 | 467581 |
| 2009 | 3016678 |
| 2010 | 397068 |
| 2011 | 516718 |
| 2012 | 524735 |
| 2013 | 525976 |
| 2014 | 497359 |
| 2015 | 343512 |
| 2016 | 285652 |
| 2017 | 357767 |
| 2018 | 240500 |
| January-August 2019 | 161800 |
The bulk of Russia's exports still go to the EU, China, Turkey, Belarus, and the USA. We supply mainly oil, gas, metals and other raw materials, as well as timber and wheat.
Main exported goods in 2021
| September 2018-September 2021, billion $ | Share | |
| Mineral products | 254.4 | 54% |
| Petroleum products | 64.8 | 13.8% |
| Metals and products made from them | 43.1 | 9.2% |
| Chemical industry products | 21.6 | 4.6% |
| Machines, equipment | 15.7 | 3.3% |
| Jewelry | 12.1 | 2.6% |
| Products of plant origin | 11.6 | 2.5% |
| Wood and wood products | 9.42 | 2% |
| Plastics, rubber and rubber | 6.63 | 1.4% |
| Animal products | 6.09 | 1.3% |
For many years, the structure of exports has been dominated by petroleum products and metals. For 12 months (from September 2021 to September 2019), sales volume amounted to 64.8 and 43.1 billion, respectively. Exports of timber reached 9.42 billion, plant products (mainly wheat) - 11.6 billion dollars. Every year, supply volumes in these areas are increasing, which is a plus.
Russian foreign trade in 2021
Russia's
foreign trade turnover in 2021 amounted to 668.7 billion US dollars and decreased by 2.9% compared to 2018, including with non-CIS countries - 587.4 billion US dollars (by 3.3%), with CIS countries – 81.3 billion US dollars (0.7%).
In the total volume of foreign trade turnover, the share of non-CIS countries in 2021 accounted for 87.8%, and the share of CIS countries – 12.2%.
Dynamics of foreign trade turnover in 2015–2019
The trade balance in 2021 amounted to 180.1 billion US dollars and decreased by 31.5 billion US dollars compared to 2021.
The ratio of the value volumes of export
and import operations
Export to Russia
in value terms in 2021 amounted to 424.4 billion US dollars and decreased by 5.8% compared to 2021, including to non-CIS countries – 370.5 billion US dollars (by 6.2%), to the CIS countries – 53.9 billion US dollars (by 2.2%).
Commodity structure of exports of the Russian Federation in 2019
In the commodity structure of Russian exports in 2021, the share of fuel and energy goods was 62.1%; the value of exports of this group decreased by 8.4% compared to 2021.
The share of metals and products made from them was 8.9%. The value of exports of metals and metal products in 2021 decreased by 13.6% compared to 2021.
The value of exports of chemical industry products in 2019 decreased by 1.5%, while the share of this product group in the total export volume was 6.4%.
The share of mechanical engineering products in Russia's total exports in 2019 was 6.6%. The export value of these products decreased by 4.5%.
The share of food products and agricultural raw materials in the value of the country's exports amounted to 5.9%. The value volume of this product group decreased by 0.8%.
Russian import
in 2021 amounted to 244.3 billion US dollars and increased by 2.3% compared to 2018, including from non-CIS countries - 216.9 billion US dollars, from the CIS countries - 27.4 billion dollars USA. At the same time, imports from non-CIS countries increased by 2.3%, and from CIS countries - by 2.6%.
Commodity structure of imports of the Russian Federation in 2019
The share of mechanical engineering products in the structure of Russian imports in 2021 amounted to 46.1%. The value of imports of mechanical engineering products remained at the 2021 level.
The share of food products and raw materials for their production in total imports in 2021 amounted to 12.3%. The value of imports of these products increased by 0.6%.
In 2021, compared to last year, purchases of chemical industry products in value terms increased by 9.6%. The share of these products was 19.6%.
The share of Russian imports of textiles, textile products and footwear in 2019 amounted to 6.2%, the value of imports of these products increased by 1.3%.
Compared to 2021, imports of metals and products made from them increased by 4.1%. The share of these goods in Russia's total imports in 2021 was 7.3%.
The European Union remains Russia's largest economic partner, accounting for 41.6% of Russian trade turnover in 2021 (42.8% in 2021), APEC countries - 31.8% (30.9%), CIS countries – 12.2% (11.9%), for the EAEU countries – 8.7% (8.3%).
Trade volumes with non-CIS countries
[1]
and CIS in 2021
| Far abroad countries | Trade turnover, billion US dollars | In percentage by 2021 | CIS countries | Trade turnover, billion US dollars | In percentage by 2021 |
| China | 111,5 | 103,0 | Belarus | 33,8 | 97,9 |
| Germany | 53,2 | 88,2 | Kazakhstan | 20,0 | 107,5 |
| Netherlands | 48,8 | 103,5 | Ukraine | 11,5 | 76,5 |
| USA | 26,2 | 104,9 | Uzbekistan | 5,1 | 115,6 |
| Türkiye | 26,1 | 102,4 | Azerbaijan | 3,2 | 126,6 |
| Italy | 25,2 | 93,6 | Armenia | 2,5 | 127,7 |
| Korea, Rep. | 24,4 | 98,2 | Kyrgyzstan | 1,9 | 98,9 |
| Japan | 20,3 | 95,6 | Moldova | 1,6 | 105,2 |
| Poland | 17,8 | 82,0 | Tajikistan | 1,0 | 110,7 |
| United Kingdom | 17,3 | 125,4 | Turkmenistan | 0,7 | 168,8 |
[1] Main trading partners of the Russian Federation
Import to Russia
Imports to Russia are linearly related to exports - this conclusion can be drawn by analyzing the dynamics of its growth since 2000.
Russian imports from 2000 to 2021
| Period, year 20__ | Import, million $ |
| 00 | 33880 |
| 01 | 41883 |
| 02 | 46177 |
| 03 | 57347 |
| 04 | 75569 |
| 05 | 98708 |
| 06 | 137807 |
| 07 | 199746 |
| 08 | 267101 |
| 09 | 167348 |
| 10 | 228912 |
| 11 | 305760 |
| 12 | 317263 |
| 13 | 315298 |
| 14 | 287063 |
| 15 | 182902 |
| 16 | 182448 |
| 17 | 227464 |
| 18 | 359100 |
| January-August 19 | 271000 |
Import volumes are growing every year, mainly for food products, medicines, vehicles, and textiles.
Key goods imported to Russia in 2011-2017
| 2011 | 2012 | 2013 | 2014 | 2015 | 2016 | 2017 | |
| food products and agricultural raw materials (except textiles) | 42535 | 40655 | 43255 | 39957 | 26650 | 25072 | 28924 |
| mineral products | 9877 | 7531 | 6936 | 7334 | 4981 | 3237 | 4476 |
| products of chemical and related industries | 46044 | 48611 | 50004 | 46480 | 33989 | 33814 | 40298 |
| leather raw materials, furs and products made from them | 1581 | 1663 | 1531 | 1282 | 822 | 819 | 1130 |
| Forest and pulp and paper products | 6743 | 6241 | 6621 | 5899 | 3631 | 3385 | 3603 |
| textiles, textile products and footwear | 16735 | 18047 | 18040 | 16318 | 10847 | 10988 | 13574 |
| metals, precious stones and products made from them | 22996 | 23259 | 22631 | 20558 | 12363 | 11898 | 16283 |
| machinery, equipment and vehicles | 1E+05 | 158318 | 152773 | 19905 | 81909 | 86158 | 87605 |
| other goods | 11183 | 12939 | 13507 | 12655 | 7712 | 7078 | 8717 |
Over the past 6 years, the main directions of import have been preserved, and steady growth has been observed.
Import details for 12 months (September 2018-September 2019)
| Product category | Total amount, billion $ | % of total imports |
| cars and equipment | 77,1 | 30,2 |
| Products of chemical and related industries | 33,2 | 13 |
| Vehicles | 28,3 | 11,1 |
| Metals | 18,9 | 7,4 |
| Plastics and products made from them | 14,7 | 5,8 |
| Textile | 12,2 | 4,8 |
| Vegetables | 11,6 | 4,5 |
| Prepared food | 11,1 | 4,4 |
30% of total imports are machinery and equipment. Moreover, the main share of exports in this category is occupied by nuclear reactors, boilers, and mechanical devices, which we import to Kazakhstan. We import mainly electrical machines and equipment, mainly from Germany and China.
Meat
Russian meat is also in demand abroad - in 2021, the Russian Federation exported more than 500 thousand tons, the figure increased by 55%, as calculated by Agroexport. In monetary terms, exports increased by 54%, to $860 million.
“According to preliminary data from the Federal Customs Service, meat products last year became the leader in terms of export growth among the six main groups of food products,” Fr.
37% of Russian meat supplies go to China, 16% to Vietnam, 13% to Ukraine.
Exports of poultry meat over the year increased by 41%, to 285 thousand tons, in monetary terms - an increase of 32%, to $419 million. And beef exports jumped almost three times, to 16 thousand tons, and 3.3 times in monetary terms, to $85 million. Pork supplies also grew: 1.9 times, to 187 thousand tons in physical terms and doubled in monetary terms ($324 million).
What conclusions can be drawn?
- • Russia's exports are stable and tend to grow.
- • Foreign trade relations with major suppliers and buyers are maintained. Key partners: China, Germany, the Netherlands, Belarus, Italy.
- • The main share of exports falls on petroleum products, metals, that is, raw materials.
- • Imports grow in proportion to export growth. We purchase mainly cars, equipment, medicines, textiles.
- • For now, the economy depends on the export of energy resources, which negatively affects GDP and the standard of living of the population.
Buckwheat
Since the beginning of the season (it starts from September 2021), Russia has also increased its exports of buckwheat - about 220 thousand tons of buckwheat and buckwheat were sold abroad. This is about a quarter of the total production and more than for the entire last season, said Dmitry Rylko. Our buckwheat is actively bought in Asia - in China and Japan, as well as in the former Soviet republics.
Simultaneously with the growth in buckwheat exports, its price on the domestic market also increased: the wholesale price of buckwheat jumped by 36%, to 70 rubles. And this is despite a record harvest in 2021.
The Ministry of Agriculture even started talking about temporarily limiting the export of buckwheat. “This proposal is associated with increased demand for buckwheat in foreign markets and, as a consequence, the risks of increasing domestic prices against the backdrop of growing exports,” Interfax quotes a representative of the press service of the Ministry of Agriculture.
Is cheap beef left in the USSR? What prevents you from establishing meat production Read more