It is enough to take one look at the structure of Russian exports to understand the serious dependence of the economy on the supply of energy resources abroad. We analyzed data from the Federal Customs Service and Rosstat to find out the volume of gas and oil exports from Russia, as well as to track the dynamics of exports from 2000 to 2021 and find out what imports of goods are important for the Russian Federation?
No matter how much the authorities strive to rid the economy of dependence on raw materials, statistics show that success in this direction is still far away. For example, the structure of Russian exports shows that more than 60% of all our foreign supplies are related to fuel and energy products. These are very huge numbers. For comparison, such high-tech exports as machinery and equipment account for only 6.5% of all supplies abroad.
Structure of Russian exports in 2021
| Export item | Share in the export structure |
| Fuel and energy products | 63,7% |
| Metals and products made from them | 9,9% |
| Chemical industry products | 6,1% |
| cars and equipment | 6,5% |
| Food products and raw materials for their production | 5,5% |
| Timber and paper products | 3,1% |
| Other products | 5,2% |
Now let’s take a closer look at the goods that generally form Russia’s exports. Last year, our most profitable export item was crude oil. Raw materials brought the country almost $130 billion. If we add petroleum products to this, it turns out that thanks to black gold we earned more than $200 billion in a year.
On the one hand, we can be happy about our good sales, but on the other hand, we are too dependent on oil. Meanwhile, a serious battle for sales markets is planned on the oil market. According to the International Energy Agency, in the next 5 years the United States will begin to export more oil than it imports, and in terms of total oil exports, the United States will overtake Russia and come as close as possible to Saudi Arabia. All this means one thing - against the backdrop of increased competition, it will become more difficult to sell oil, which means the powerful financial source of our economy could dry up at any moment.
FAQ
- Almost 10% of Russia's GDP comes from international trade. Is it good or bad? Depends on the situation. On the one hand, a large income (10% of GDP) from foreign trade is an “addition” to its own GDP, the country becomes significantly richer. On the other hand, crises, pandemics and other global problems hit the country’s economy harder, a significant part of its income comes from international trade.
- Where did you get the information? Rosstat, database of the Federal Statistics Service.
Export of gas, oil, grain from Russia (Federal Customs Service data)
| Name of product | Volume in 2021, dollars | Volume in 2021, dollars |
| Crude oil | 93.3 billion | 129.0 billion |
| Petroleum products | 58.2 billion | 78.1 billion |
| Natural gas | 38.1 billion | 49.1 billion |
| cars and equipment | 28.0 billion | 29.0 billion |
| Diesel fuel | 23.2 billion | 33.1 billion |
| Black metals | 18.7 billion | 23.3 billion |
| Coal | 13.5 billion | 17.0 billion |
| Wheat and meslin | 5.7 billion | 8.4 billion |
| Wood and materials | 5.4 billion | 5.9 billion |
| Aluminum | 5.4 billion | 5.3 billion |
| Passenger cars | 1.3 billion | 1.2 billion |
| Trucks | 0.3 billion | 0.3 billion |
| Electricity | 0.6 billion | 0.8 billion |
| Vodka | 0.1 billion | 0.1 billion |
The economy may have to be saved through gas supplies. In 2018, gas exports from Russia amounted to $49 billion. This is $11 billion more than in 2021. Also last year, we exported ferrous metals worth $23 billion, forests – $5.9 billion, wheat – $8.4 billion.
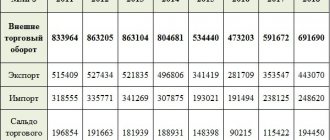
Comparing Russia's exports over the years, it should be noted that in the first month of 2021, the export volume amounted to $31.6 billion. A fairly vigorous start to the year, which allows us to hope for good results
Russian imports from EU countries in 2021
| EU | January - September 2021 ($ million) | January - September 2021 ($ million) |
| AUSTRIA | 1 902,8 | 1 729,8 |
| BELGIUM | 1 735,3 | 1 559,1 |
| BULGARIA | 407,6 | 364,0 |
| HUNGARY | 1 587,9 | 1 484,2 |
| GERMANY | 18 012,3 | 16 326,8 |
| GREECE | 180,3 | 157,8 |
| DENMARK | 846,3 | 815,5 |
| IRELAND | 1 134,5 | 1 145,1 |
| SPAIN | 2 325,9 | 2 187,1 |
| ITALY | 7 537,5 | 6 990,7 |
| CYPRUS | 12,6 | 9,1 |
| LATVIA | 333,5 | 326,5 |
| LITHUANIA | 404,3 | 394,5 |
| LUXEMBOURG | 131,0 | 150,8 |
| MALTA | 12,7 | 16,2 |
| NETHERLANDS | 2 763,8 | 2 722,3 |
| POLAND | 3 619,8 | 3 360,2 |
| PORTUGAL | 388,8 | 358,5 |
| ROMANIA | 1 098,1 | 886,0 |
| SLOVAKIA | 1 574,5 | 1 168,5 |
| SLOVENIA | 737,7 | 690,6 |
| UNITED KINGDOM | 2 863,4 | 2 380,8 |
| FINLAND | 2 630,5 | 2 050,9 |
| FRANCE | 5 734,5 | 5 741,3 |
| CROATIA | 134,0 | 126,5 |
| CZECH | 2 598,2 | 2 558,2 |
| SWEDEN | 1 594,5 | 1 325,0 |
| Estonia | 351,0 | 354,0 |
Source: Federal Customs Service
Russian exports by year (2000-2019)
| Period | Export volume, dollars |
| January 2021 | 31.6 billion |
| 2018 | 452.1 billion |
| 2017 | 359.1 billion |
| 2016 | 285.6 billion |
| 2015 | 343.5 billion |
| year 2014 | 497.3 billion |
| year 2013 | 525.9 billion |
| year 2012 | 524.7 billion |
| 2011 | 516.7 billion |
| 2010 | 397.0 billion |
| year 2009 | 301.6 billion |
| 2008 | 467.5 billion |
| 2007 | 351.9 billion |
| 2006 | 301.2 billion |
| 2005 year | 241.4 billion |
| 2004 | 181.6 billion |
| 2003 | 133.6 billion |
| 2002 | 106.7 billion |
| year 2001 | 99.9 billion |
| year 2000 | 103.0 billion |
In 2021, exports exceeded $450 billion. For several years in a row, the volume of exports has been increasing and rising oil prices have played a significant role in this. For example, in 2021, exports were at $285 billion, in 2021 the figure jumped to $359 billion, and finally in 2021 to $452 billion.
If we take the busiest years in terms of export volumes, then the years 2011-2013 stand out, when we annually supplied our goods worth more than $0.5 trillion. However, if current oil prices continue to rise to new heights, we will quickly be able to return to these levels. True, no one knows for how long.
Among our key foreign trade partners, the European Union stands out. The volume of our exports to this region in just one month of 1019 amounted to more than $15 billion. In January, we exported goods worth $4 billion to China, and $1.6 billion to Turkey. Among the countries of the former USSR, a significant volume of exports falls on Belarus, Kazakhstan, and Ukraine.
Forecasts
At the end of this year, according to the pessimistic forecast of WTO experts, we can expect a drop in global trade volumes by an average of 32% compared to 2021. The reason for such a negative forecast is that despite all the measures taken by governments of different countries, uncertainty regarding the pandemic remains.
At the same time, according to an optimistic forecast, which is based on the imminent lifting of restrictions on the import of goods in most countries of the world, the decline could be about 13% by the end of the current year.
As for forecasts for 2021, the WTO, IMF, World Bank and OECD unanimously predict a recovery in international trade. In particular, the World Trade Organization suggests that, in the best case, the growth of imports and exports in the coming year could be about 24% relative to 2021. In the pessimistic forecast, growth volumes are also large - 21.3% in annual terms.
Export to individual countries and groups of countries
| Region | Export volume in January 2021, dollars |
| EU | 15.3 billion |
| China | 4.0 billion |
| Türkiye | 1.6 billion |
| Belarus | 1.4 billion |
| USA | 0.7 billion |
| Kazakhstan | 0.7 billion |
| Uzbekistan | 0.2 billion |
| Ukraine | 0.4 billion |
While we most often export raw materials and resources, imports mainly consist of purchases of machinery and equipment. This import item accounts for $112 billion. All other types of goods are too far from the leader in the import structure, although the country also imports medicines, cars, clothing, etc.
Russian imports from CIS countries in 2021
| A country | Import (million $) | |
| January-September 2019 | January-September 2020 | |
| Azerbaijan | 591,4 | 586,1 |
| Armenia | 586,1 | 443,9 |
| Belarus | 10011,1 | 9501,5 |
| Kazakhstan | 4193,7 | 3541,9 |
| Kergyzstan | 239,2 | 167,3 |
| The Republic of Moldova | 277,3 | 263,8 |
| Tajikistan | 22,6 | 21,5 |
| Turkmenistan | 113,6 | 283,4 |
| Uzbekistan | 866,7 | 894,5 |
| Ukraine | 3656,8 | 2731,3 |
Source: Federal Customs Service
Import of key goods to Russia (Federal Customs Service data)
| Name of product | Volume in 2021, dollars | Volume in 2021, dollars |
| cars and equipment | 110.2 billion | 112.6 billion |
| Medicines | 8.5 billion | 8.0 billion |
| Passenger cars | 6.6 billion | 7.2 billion |
| Cloth | 6.5 billion | 7.0 billion |
| Meat | 2.0 billion | 1.4 billion |
| Fish | 1.1 billion | 1.2 billion |
| Citrus | 1.1 billion | 1.2 billion |
| Beverages | 2.4 billion | 2.6 billion |
| Shoes | 1.5 billion | 1.7 billion |
| Trucks | 1.9 billion | 1.9 billion |
| Furniture | 1.6 billion | 1.9 billion |
Imports, as a rule, grow behind exports. In 2011-2013, simultaneously with the growth of exports, the volume of imports also jumped, amounting to $305-317 billion. In 2021, we imported goods worth $240.5 billion, and in January 2021 – $15.6 billion.
Russian imports from APEC countries in 2021
| APEC | January - September 2021 ($ million) | January - September 2021 ($ million) |
| AUSTRALIA | 514,2 | 491,9 |
| VIETNAM | 2 787,5 | 2 993,3 |
| HONG KONG | 325,5 | 295,2 |
| INDONESIA | 1 222,1 | 1 276,3 |
| CANADA | 675,1 | 616,6 |
| CHINA | 38 682,1 | 39 084,2 |
| REPUBLIC OF KOREA | 6 092,0 | 4 530,6 |
| MALAYSIA | 1 251,5 | 1 095,7 |
| MEXICO | 785,5 | 686,0 |
| NEW ZEALAND | 153,5 | 209,6 |
| PAPUA NEW GUINEA | 3,1 | 2,6 |
| PERU | 185,6 | 153,8 |
| SINGAPORE | 394,4 | 369,2 |
| USA | 9 907,3 | 9 652,5 |
| THAILAND | 1 290,1 | 1 046,8 |
| TAIWAN (CHINA) | 1 438,9 | 1 350,8 |
| PHILIPPINES | 294,8 | 276,7 |
| CHILE | 70,2 | 600,8 |
Source: Federal Customs Service
Russia's imports by year (2000-2019)
| Period | Import volume, dollars |
| January 2021 | 15.6 billion |
| 2018 | 240.5 billion |
| 2017 | 228.5 billion |
| 2016 | 182.2 billion |
| 2015 | 182.9 billion |
| year 2014 | 287.0 billion |
| year 2013 | 315.2 billion |
| year 2012 | 317.2 billion |
| 2011 | 305.7 billion |
| 2010 | 228.9 billion |
| year 2009 | 167.3 billion |
| 2008 | 267.1 billion |
| 2007 | 199.7 billion |
| 2006 | 137.8 billion |
| 2005 year | 98.7 billion |
| 2004 | 75.5 billion |
| 2003 | 57.3 billion |
| 2002 | 46.1 billion |
| year 2001 | 41.8 billion |
| year 2000 | 33.8 billion |
The economy's dependence on energy supplies has a negative impact on GDP dynamics, which in turn affects household incomes. The poverty situation today is striking in its scale. For millions of citizens, the only way to get through the month was through loans without refusal. Loans are available from the age of 18, even to students. You can take money in a matter of minutes without certificates, guarantors or collateral.
Loading …
Product partners of Russia – analytics of partner countries
Rosstat separately identifies 2 sources of import/export, the first source is non-CIS countries, the second is CIS countries. From the CIS countries, statistics on trade with the EurAsEC/EAEU are kept separately. Export table by country:
| Year | With foreign countries, millions of dollars | With foreign countries, as a percentage of the previous year | With CIS countries, in millions of dollars | With CIS countries, as a percentage of the previous year | With EurAsEC/EAEU countries, millions of dollars | With EurAsEC/EAEU countries, as a percentage of the previous year |
| 1995 | 63687 | 129,4 | 14530 | 103,2 | 5815 | 104,8 |
| 1996 | 69294 | 108,8 | 15895 | 109,4 | 6383 | 109,8 |
| 1997 | 68472 | 98,8 | 16624 | 104,6 | 7401 | 115,9 |
| 1998 | 57614 | 84,1 | 13699 | 82,4 | 6773 | 91,5 |
| 1999 | 62179 | 107,9 | 10707 | 78,2 | 5143 | 75,9 |
| 2000 | 89269 | 143,6 | 13824 | 129,1 | 7974 | 155,0 |
| 2001 | 85352 | 95,6 | 14617 | 105,7 | 8278 | 103,8 |
| 2002 | 91001 | 106,6 | 15711 | 107,5 | 8497 | 102,6 |
| 2003 | 113157 | 124,3 | 20498 | 130,5 | 11172 | 131,5 |
| 2004 | 152129 | 134,4 | 29471 | 143,8 | 16335 | 146,2 |
| 2005 | 208846 | 137,3 | 32627 | 110,7 | 17269 | 105,7 |
| 2006 | 258934 | 124,0 | 42310 | 129,7 | 23004 | 133,2 |
| 2007 | 299267 | 115,6 | 52661 | 124,5 | 30611 | 133,1 |
| 2008 | 397925 | 133,0 | 69656 | 132,3 | 38908 | 127,1 |
| 2009 | 254856 | 64,0 | 46811 | 67,2 | 27363 | 70,3 |
| 2010 | 337467 | 132,4 | 59601 | 127,3 | 30435 | 111,2 |
| 2011 | 437283 | 129,6 | 79435 | 133,3 | 40910 | 134,4 |
| 2012 | 445478 | 101,9 | 79258 | 99,8 | 43133 | 105,4 |
| 2013 | 452036 | 101,5 | 73940 | 93,3 | 40764 | 94,5 |
| 2014 | 433173 | 95,8 | 64186 | 86,8 | 36901 | 90,5 |
| 2015 | 298420 | 68,9 | 45092 | 70,3 | 28564 | … |
| 2016 | 247687 | 83,0 | 37966 | 84,2 | 25870 | 90,6 |
| 2017 | 309688 | 125,0 | 48079 | 126,6 | 33726 | 130,4 |
| 2018 | 394675 | 127,7 | 54889 | 113,9 | 37993 | 112,5 |
Infographics (red – abroad, blue – CIS, green – EurAsEC/EAEU):
Import table by country:
| Year | With foreign countries, millions of dollars | With foreign countries, as a percentage of the previous year | With CIS countries, in millions of dollars | With CIS countries, as a percentage of the previous year | With EurAsEC/EAEU countries, millions of dollars | With EurAsEC/EAEU countries, as a percentage of the previous year |
| 1995 | 33117 | 116,8 | 13592 | 131,7 | 5128 | 119,9 |
| 1996 | 31909 | 96,4 | 14549 | 107,0 | 6300 | 122,9 |
| 1997 | 38889 | 121,9 | 14234 | 97,8 | 7769 | 123,3 |
| 1998 | 32266 | 83,0 | 11313 | 79,5 | 6684 | 86,0 |
| 1999 | 21935 | 68,0 | 8343 | 73,7 | 4826 | 72,2 |
| 2000 | 22276 | 101,6 | 11604 | 139,1 | 6236 | 129,2 |
| 2001 | 30681 | 137,7 | 11202 | 96,5 | 6169 | 98,9 |
| 2002 | 36014 | 117,4 | 10163 | 90,7 | 6063 | 98,3 |
| 2003 | 44207 | 122,7 | 13139 | 129,3 | 7528 | 124,2 |
| 2004 | 57856 | 130,9 | 17713 | 134,8 | 10140 | 134,7 |
| 2005 | 79712 | 137,8 | 18996 | 107,2 | 9181 | 90,5 |
| 2006 | 115433 | 144,8 | 22374 | 117,8 | 11006 | 119,9 |
| 2007 | 169875 | 147,2 | 29878 | 133,5 | 13955 | 126,8 |
| 2008 | 230494 | 135,7 | 36607 | 122,5 | 17635 | 126,4 |
| 2009 | 145530 | 63,1 | 21818 | 59,6 | 10996 | 62,4 |
| 2010 | 197184 | 135,5 | 31728 | 145,4 | 15010 | 136,5 |
| 2011 | 260920 | 132,3 | 44841 | 141,3 | 21469 | 143,0 |
| 2012 | 272323 | 104,4 | 44941 | 100,2 | 24078 | 112,2 |
| 2013 | 276310 | 101,5 | 38988 | 86,8 | 20392 | 84,7 |
| 2014 | 253776 | 91,8 | 33287 | 85,4 | 20306 | 99,6 |
| 2015 | 161693 | 63,7 | 21210 | 63,7 | 14106 | … |
| 2016 | 162658 | 100,6 | 19790 | 93,3 | 13916 | 98,7 |
| 2017 | 202608 | 124,6 | 24856 | 125,6 | 17801 | 127,9 |
| 2018 | 212026 | 104,5 | 26468 | 105,9 | 18646 | 104,2 |
Infographics (red – abroad, blue – CIS, green – EurAsEC/EAEU):
As can be seen from the data, neither the CIS, nor the EurAsEC/EAEU in particular are the main directions of Russia's trade - the largest share in the volume of trade is made up of far-abroad countries.
Volume of exports and imports for January-August 2021
| Amount, million $ | |
| General | 429,2 |
| European Union, total amount | 180 |
| Great Britain | 9,3 |
| Finland | 9,3 |
| France | 9 |
| APEC countries | 136,6 |
| China | 70 |
| Korea | 16,7 |
| United States | 17,4 |
| Japan | 13,2 |
| Türkiye | 17,6 |
| Switzerland | 4,1 |
| countries of the Commonwealth of Independent States, total amount | 51,8 |
| Azerbaijan | 2 |
| EAEU countries, total amount | 36,4 |
| Belarus | 21,4 |
| Kazakhstan | 12,5 |
| Ukraine | 8,3 |
In terms of trade turnover, the top 10 countries include: China, Germany, the Netherlands, Belarus, Italy, Turkey, USA, Poland, Japan, Kazakhstan.
What conclusions can be drawn?
- • Russia's exports are stable and tend to grow.
- • Foreign trade relations with major suppliers and buyers are maintained. Key partners: China, Germany, the Netherlands, Belarus, Italy.
- • The main share of exports falls on petroleum products, metals, that is, raw materials.
- • Imports grow in proportion to export growth. We purchase mainly cars, equipment, medicines, textiles.
- • For now, the economy depends on the export of energy resources, which negatively affects GDP and the standard of living of the population.